
Market dynamics and pricing
How pricing elasticity shapes pricing strategy

TL;DR
Most pricing strategy ignores market dynamics. Two measures — price elasticity of demand and cross-price elasticity — tell you almost everything about what pricing moves will actually work.
These two elasticities define a 2×2 grid. Which quadrant you’re in determines whether you should optimize, differentiate, defend, or adapt.
High demand elasticity + high cross-price elasticity is chaos. Small price moves may trigger large, unpredictable reactions. Escape by building differentiation and stickiness.
High demand elasticity + low cross-price elasticity is the price optimization zone. Standard tools work here — but you can only optimize one thing at a time: volume, revenue, or margin.
Low demand elasticity + high cross-price elasticity is the danger zone. Cutting prices won’t grow the market — it just triggers a price war that destroys value for everyone. Game theory has the answer: Tit for Tat with forgiveness.
Low demand elasticity + low cross-price elasticity is where most B2B SaaS companies live — and where value-based pricing wins. Know your value capture ratio. Compete on value, not price.
Generative AI is redrawing the map. Markets that felt stable are shifting quadrants. What worked last year may not work in 2026.
The strategic imperative: know your quadrant, track what could move you out of it, and price accordingly.
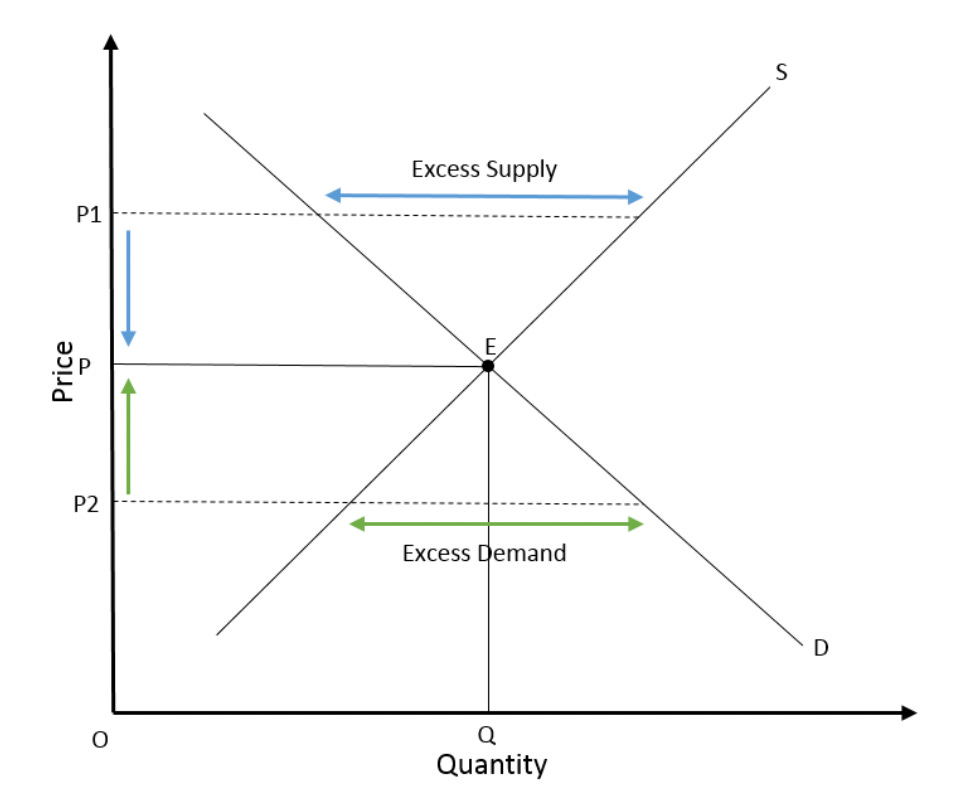
Academic treatments of pricing often focus on price elasticity and the market clearing price. We all know the graphic showing demand going down as price goes up and supply going up as price goes up. The point where these lines cross (in reality they are at best probability distributions) is the market clearing price.
Price Elasticity of Demand (PED) = % Change in Quantity Demanded / % Change in Price
When PED = 1 a 1% change in price cause a 1% change in demand (PED can be higher than 1)
When PED = 0 price has no impact on demand (in the real world there are often price ranges where PED is effectively zero).
Price elasticity of demand is not the only type of elasticity that pricers are concerned with. Cross price elasticity is just as important. This is the impact of a price change or price differential on the choice between two alternatives. Cross-price elasticity of demand measures how the quantity demanded of one good (A) changes in response to a price change in another good (B). It is calculated as the percentage change in quantity demanded of Good A divided by the percentage change in price of Good A, determining if goods are substitutes or complements.
If cross price elasticity is positive the goods or services are substitutes and are competing with each other. If the value is negative they are complements, and consumption of one tends to encourage consumption of the other. Knowing ones substitutes and complements is key to pricing strategy.
Things get really interesting when you combine the two.
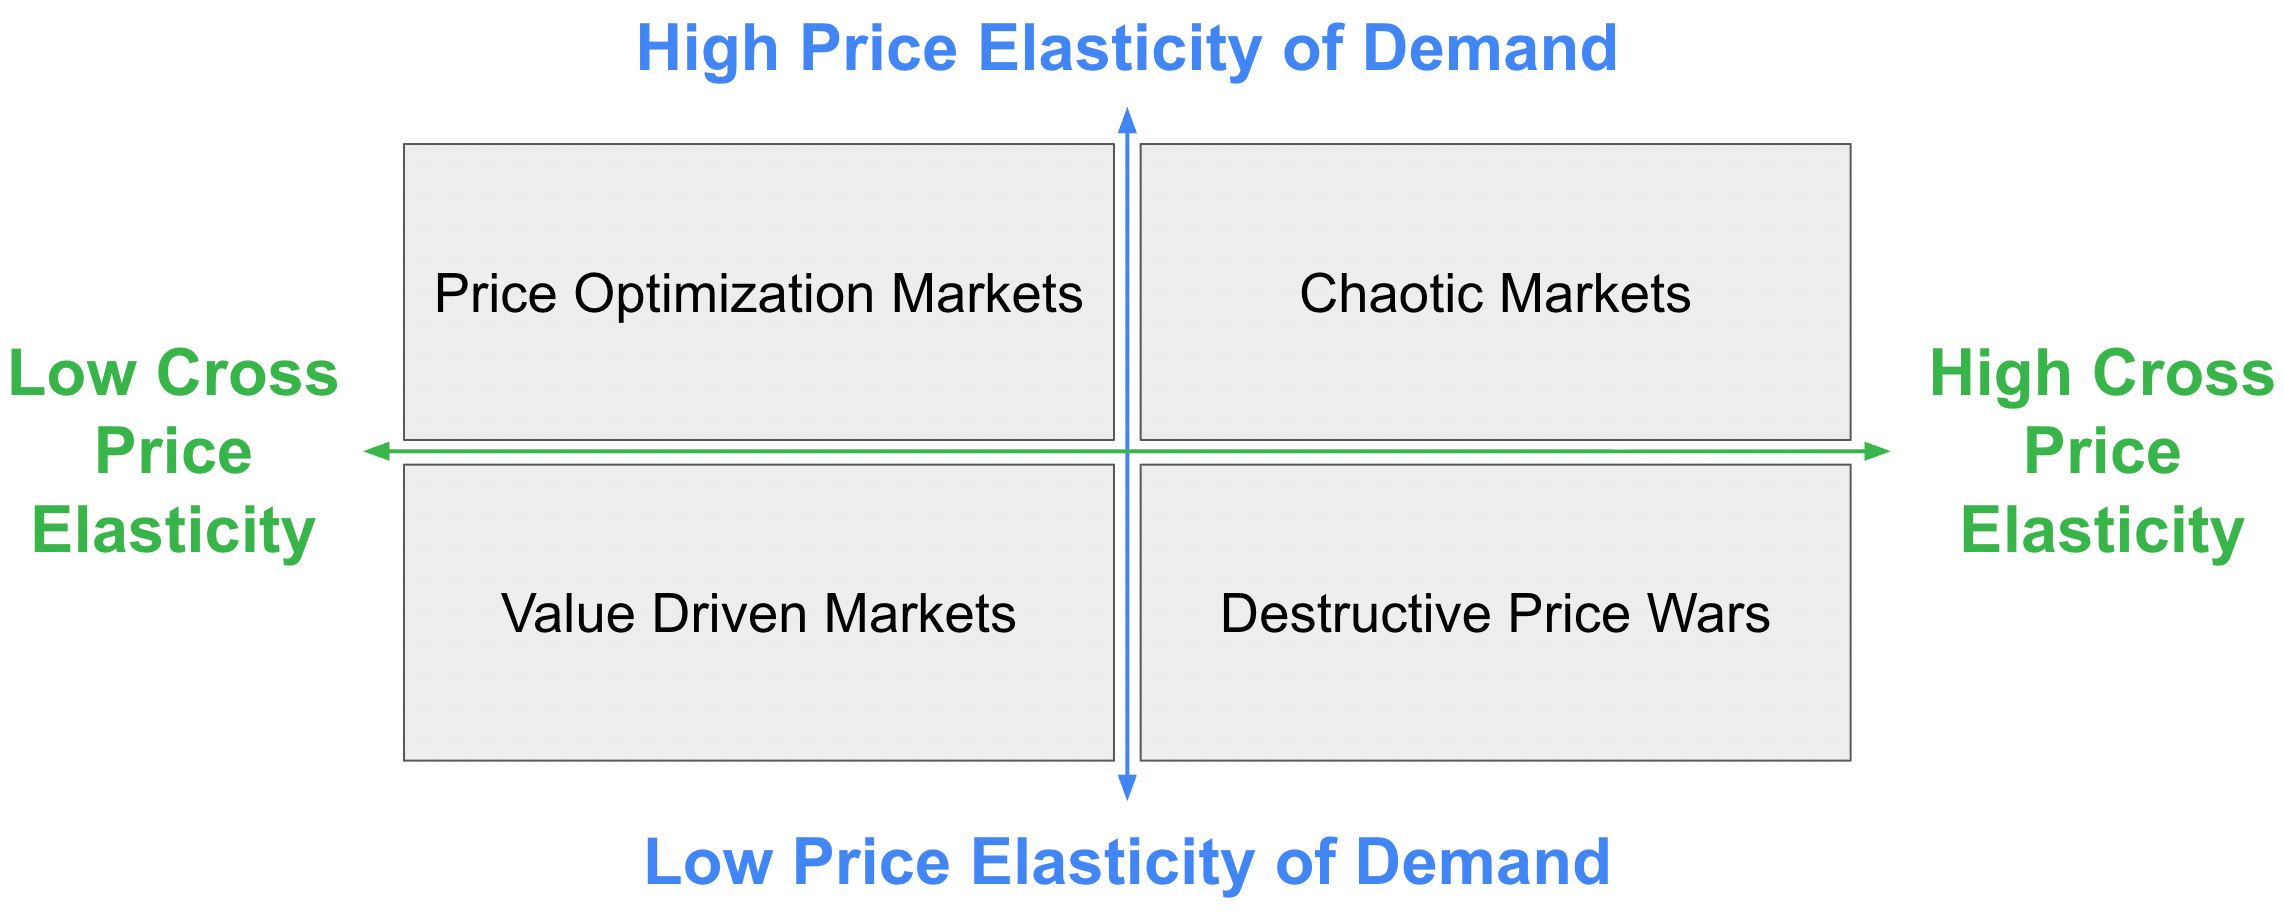
The market dynamics grid
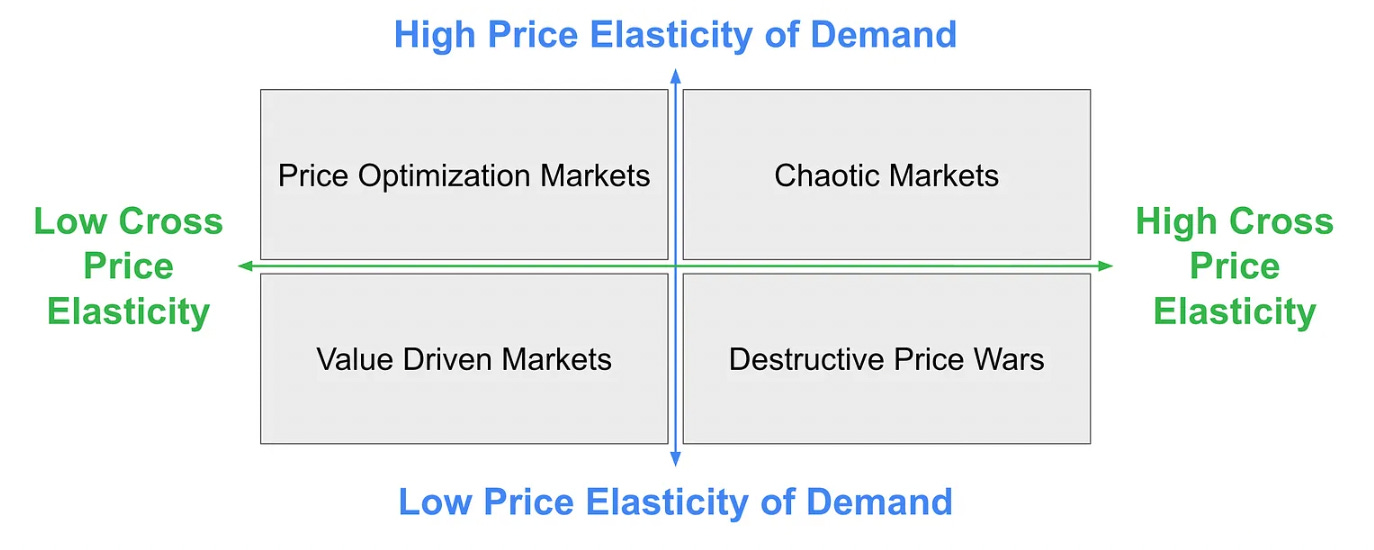
Price elasticity of demand and cross price elasticity interact in important ways.
High Price Elasticity of Demand + High Cross Price Elasticity
High Price Elasticity of Demand + Low Cross Price Elasticity
Low Price Elasticity of Demand + High Cross Price Elasticity
Low Price Elasticity of Demand + Low Cross Price Elasticity
Which quadrant you find yourself in has a big impact on successful pricing, And to make things even more fun, changes to technology and external market conditions can move a market from one quadrant to another.
High Price Elasticity of Demand + High Cross Price Elasticity
This is often assumed to he the default, a low friction world of perfect and symmetric information. It does not exist. The closer we get to it though, the more chaotic prices will be. This is the world of chaos theory and strange attractors where small differences can lead to large changes. Pricing in the top right quadrant is full of strange attractors (like the Lorenz attractor) and other
This is not a place where most pricing experts want to live. It is rather the domain of traders (and these days most traders are some form of bot). Pricers caught here will push product owners to deliver more differentiation and thereby reduce the cross price elasticity. Generally, reducing cost price elasticity should be a shared product and pricing goals (this is also known as making a product ‘sticky’).
For a bit of fun, check out this Perplexity thread on “The Lorenz Attractor as a Framework for High-Elasticity Price Dynamics.”
Examples
Cloud object storage (AWS S3 vs. Azure Blob vs. Google Cloud Storage) — Pricing is nearly identical across vendors and has been in a multi-year race to zero. Customers move workloads based on marginal price differences and egress fees. Any unilateral price move triggers instant competitive reaction.
Generic SMS/email API providers (e.g., commodity tiers of Twilio competitors like Vonage, Sinch) — Bare-bones messaging APIs with minimal differentiation. Enterprise buyers use aggregators that automatically route to the cheapest provider, making cross-price sensitivity near-perfect.
AI inference commodity APIs — The emerging market for raw LLM inference (e.g., Together.ai, Fireworks AI, Groq vs. each other on commodity open-weight models like Llama). Switching cost is a single API endpoint change; pricing per token is the only real lever.
High Price Elasticity of Demand + Low Cross Price Elasticity
This quadrant is the world of price optimization. Conventional price optimization software works quite well in these markets. Price optimization can optimize different things:
Volume
Revenue
Margin
Capacity utilization
Market share
Remember though that you can only optimize one thing at a time and that there will be tradeoffs to manage. Decisions here are based on typical three factor tradeoffs. Most of us know this from the project management mantra, Price, Speed, Quality, choose two. This tradeoff pattern shows up in many other places. In this context some of the typical tradeoffs are as follows.
Volume - Revenue - Margin (you cannot optimize for all three but you can often satisfice for two of the three)
Capacity Utilization - Market Share - Margin
Volume - Capacity Utilization - Margin
Margin shows up in all of these tradeoffs. This is one reason that pricing experts spend more time thinking about the impact of price on margin than other business functions.
Note: Software pricing experts are not used to thinking about pricing for capacity utilization, but that is changing as generative AI makes technology more capital intensive. See Pricing implications of hyperscaling.
Examples
HubSpot (SMB tiers) — SMB buyers are price-sensitive; a 20% price increase causes real churn. But they don’t defect to Salesforce — the next-best alternative is too complex. HubSpot optimizes volume vs. margin tradeoffs aggressively through seat count and contact-tier pricing.
Zoom (core video conferencing) — Price-sensitive buyers (especially PLG/prosumer users), but alternatives like Google Meet or Teams are bundled into existing suites rather than purchased as substitutes. Zoom optimizes around free-to-paid conversion rates and seat expansion.
Shopify (basic/standard plans) — SMB merchants are sensitive to monthly fees, but switching e-commerce platforms has high operational friction. Shopify runs classic volume-revenue-margin tradeoffs through plan tiering and app marketplace economics.
Low Price Elasticity of Demand + High Cross Price Elasticity
This is the most dangerous quadrant. It is where value destroying price wars take place. Cutting prices will not do much to increase overall demand, but it will lure some customers over to the vendor offering lower prices. If that was all there is to it that would be fine, price and demand would quickly stabilize. But that is not what generally happens. Most companies, when faced with customer poaching will hit back, lowering their own prices, and triggering a feedback loop that drives pricing down and can destroy long term market value for all market participants.
There are two ways to avoid this.
Do not engage in price wars, send strong signals that ‘we will not be undersold’ and then adopt a ‘tit for tat with forgiveness’ strategy (see the comments below on Prisoner’s Dilemma)
Get out of this trap by either developing differentiation and stickiness (reducing cross price elasticity) or find ways to increase price elasticity of demand (and move into a chaotic market)
There are many similarities between this quadrant and the game of Prisoner’s Dilemma, and the winning strategies for Prisoner Dilemma also work here.
Prisoner’s Dilemma is a classic game theory thought experiment in which two rational players must independently choose to either cooperate or defect, without knowing the other’s decision. The cruel logic is that defection is the individually dominant strategy — no matter what the other player does, you’re better off betraying them (cutting prices) — yet if both defect, both end up worse off than if both had cooperated. The paradox is that collective rationality and individual rationality point in opposite directions.
In the single-shot version, the Nash equilibrium is mutual defection. But in the iterated version — where the same players meet repeatedly — cooperation can emerge.
Trust can emerge spontaneously among self-interested agents when interactions are repeated and the future matters. “Nice” strategies — those that never defect first — are the most successful. Evolutionary simulations show that Tit For Tat strategies, once established, tend to crowd out exploitative ones because they thrive in cooperation with each other while being resistant to defectors.
One important nuance: in “noisy” environments where moves can be miscommunicated, Generous Tit for Tat (occasionally forgiving a defection rather than always retaliating) can outperform strict TFT by breaking accidental retaliation spirals.
See Robert Axelrod The Evolution of Cooperation.
Examples
CRM mid-market (Salesforce vs. Microsoft Dynamics vs. SAP CRM) — Large enterprises aren’t going to buy more CRM because it’s cheaper, but procurement will aggressively pit vendors against each other. Unilateral discounting by one triggers matched concessions industry-wide, destroying long-term value.
On-premise ERP cloud migration (SAP vs. Oracle vs. Workday in mature enterprise) — Total demand is fixed (existing SAP/Oracle shops migrating to cloud). Price concessions mostly just shift share rather than grow the market, with both vendors locked in destructive discount cycles.
Cybersecurity endpoint detection (CrowdStrike vs. SentinelOne vs. Microsoft Defender) — Security budgets are relatively fixed; an enterprise isn’t buying more security because EDR prices dropped. But vendors heavily compete on price to win replacement deals. The rational play is Tit-for-Tat signaling, not a race to the bottom.
Low Price Elasticity of Demand + Low Cross Price Elasticity
In the real world, many B2B SaaS markets have low price elasticity of demand and low cross price elasticity. This is generally true of markets where there is finite demand (one can have a mature market), meaningful differentiation and high switching costs. This is where most B2B software markets end up for long periods of time. Of course if innovation falters, and commodization becomes common, these markets can devolve into the Low Price Elasticity of Demand + High Cross Price Elasticity quadrant.
In this quadrant value based pricing comes into its own. You win by connecting price to value, establishing target value capture ratios (valueIQ calculates this for you and calls it the vIQ Score). Value discipline is critical to success.
The foundation for pricing is a value model. EVE (Economic Value Estimation) models are a structured framework for quantifying the monetary value a product or service delivers to a specific customer relative to their next best alternative (NBA). Technically they are a set of equations that work together to estimate the value a solution provides to a customer relative to the alternative. They were introduced by Tom Nagle in his classic text The Strategy and Tactics of Pricing, now in its 7th ediction.
The value capture ration (VCR or vIQ score) is the percent of total value captured back in price. If you create $100 in value and price at $20 the value capture ratio is 20%. See Ed Arnold’s recent post on The Valorizer: Value Capture - How much is too much.
Value discipline means making sure that one always understands value to customer (V2C) uses this to inform tradeoffs, and when pushed on price responding by adjusting value (finding ways to increase the value of the deal to each party and when that is impossible systematically reducing value along with discounts or other price concessions).
Examples
Veeva Systems (life sciences CRM/vault) — Pharmaceutical companies don’t stop buying Veeva because prices rise slightly, and there’s no credible substitute that understands FDA compliance workflows. Veeva’s Value Capture Ratio is extremely high; pricing is anchored to regulatory and commercial value delivered.
Palantir (Foundry/AIP for large enterprises) — Deep institutional embedding, custom data ontologies, and mission-critical use cases make demand nearly inelastic. Switching costs are measured in years of retraining and data migration. Palantir competes on delivered outcomes, not price.
Snowflake (data cloud for large enterprise) — Once an organization’s data ecosystem is built on Snowflake’s architecture, demand elasticity drops sharply. Competitors (Databricks, BigQuery) exist, but CPE is low because migration costs and ecosystem lock-in are substantial. Snowflake wins by expanding value (new workloads, Cortex AI features) rather than cutting price.
ServiceNow (ITSM/enterprise workflow) — ServiceNow’s platform becomes the operational backbone of IT departments. Price increases in recent years have met minimal churn because alternatives require full workflow re-architecture. Classic value-discipline territory.
Conclusion
Your position in the market dynamics grid is not fate. It is a signal — and a call to act.
The two elasticities, price elasticity of demand and cross price elasticity, interact to shape the terrain you are pricing on. Most B2B SaaS companies aspire to the bottom-left quadrant: low demand elasticity, low cross-price elasticity. That is where value-based pricing compounds. That is where you win on differentiation, not desperation.
But markets move. Generative AI is already pushing some software markets toward higher capital intensity and new substitution dynamics. Know which quadrant you are in today — and monitor the forces that could shift you.
The bottom-left quadrant rewards value discipline. Build your value model. Track your value capture ratio. When customers push back on price, resist the reflex to cut. Instead, restructure value.
The bottom-right quadrant is the one most companies stumble into without realizing it. Price wars look like competitive strategy. They are not. They are Prisoner’s Dilemmas dressed up as tactics. The iterated game has a better answer: signal cooperation, play Tit for Tat with forgiveness, and invest in differentiation that reduces cross-price elasticity.
Three things to do this week:
Map your products against the market dynamics grid
Estimate your current value capture ratio (the valueIQ can help you do this)
Identify one product or feature investment that would reduce your cross-price elasticity
Pricing strategy without taking into account market dynamics is likely to go wrong. With it, pricing can become strategic.
I love the thinking and the chart. You may want to be clear that cross-price elasticity relates to competitors. (At least how I interpret your chart). Sometimes, cross-price elasticity is with complementary companies (peanut butter and jelly), and sometimes it's within your own company (McD's hamburger and fries or 2 versions of a product).
Can you provide specific examples for each of these quadrants? That would make this much easier to digest.