
Emerging Frameworks for the Design of Credit-Based Pricing
A practitioner methodology for AI applications, copilots, and agents

Inspired by Michael Mansard’s recent (April 22, 2026) work “AI Credit Monetization: From Hype to Concrete Blueprint (COMPASS Framework #4)” This is a first attempt to integrate emerging approaches to credit based pricing design.
TL;DR
The core problem
Most companies design credit models wrong — anchoring to cost, not value
The errors compound: flawed unit design corrupts everything downstream
Credits are a payment mechanism, not a price metric — resolve the pricing metric first
Without customer segmentation, credit pricing is a weighted average that serves no segment well
The non-negotiable design sequence
Write design principles before any analytical work begins
Segment customers by use case intensity, value sensitivity, and sophistication
Identify your business model type (Copilot / Agent / AI-Enabled Service)
Select the pricing metric — one clear sentence: “One credit represents [X]”
Build the value model using EVE (Reference Value + Differentiation Value), then the cost model, then define the LCD credit unit
Assign credit weights from the Value Weight Table — never the Cost Weight Table
Set price per credit by triangulating: cost floor + competitive anchor + WTP research (conjoint for actions, van Westendorp for packs)
Design packaging, lifecycle rules, governance tooling, and engagement incentives
Position competitively and design the pricing page
Rebuild the commercial motion — sales comp, CS triggers, CFO dashboard
Add competitive response protocols and A2A pricing architecture
Instrument, monitor, and iterate continuously
The 7 frameworks and when to use them
COMPASS (Mansard/Zuora) — use when you haven’t yet decided what to charge for
10-Choice System (Forth/Patternmind/valueIQ) — use for rigorous end-to-end design with a dedicated pricing team
Wilton Four-Step Calibration — use when the architecture is set and you need to calibrate credit weights pragmatically
Credit-Led Growth / CLG (Medina/Paid.ai) — use to rebuild your commercial motion around agentic labor
BVP AI Pricing Playbook — use to validate your business model type before designing anything
Kyle Poyar 2×2 + Dual-Track — use to position competitively and separate value billing from cost billing
Metronome AI Pricing Index — use to benchmark your design against 50+ live models
The most common failures to fix now
Credits charged on failed agent runs — switch to output trigger immediately
Cost-plus credit weights — rebuild the value model using EVE; use Reference Value + Differentiation Value
No customer segmentation — credit models without segments systematically underprice high-value customers
Seed tiers too small to reach first value — ensure 3+ full use case completions
No consumption simulator — second-leading cause of low engagement
Sales team on seat-based comp running a credit model — restructure on committed pool ARR
Non-expiring credits — this is an ASC 606 liability, not a design preference
The one rule that never changes
Value > Price > Cost — at every consumption volume, for every customer segment.
Intellectual Foundation
The methodology in this document rests on three layers of intellectual lineage that practitioners should understand explicitly.
Layer 1: Nagle’s Economic Value Estimation (EVE). Thomas Nagle’s The Strategy and Tactics of Pricing established that value-based pricing requires quantifying the economic value a customer receives relative to their next-best alternative. EVE = Reference Value + Positive Differentiation Value − Negative Differentiation Value. This is not an aspirational principle; it is a calculation. Every price that cannot be traced back to a quantified differentiation value is, by definition, a guess.
Layer 2: Forth’s SaaS EVE Application. Steven Forth and his colleagues have adapted EVE for B2B SaaS, where the “product” is a recurring software service rather than a discrete good. The adaptations include: value models built at the feature and workflow level; value realization curves that account for time-to-value and adoption dynamics; and segmentation by use case intensity rather than by company size alone. The 10-Choice Design System is the operational expression of EVE for SaaS pricing.
Layer 3: Credit-Based EVE Adaptation. Credit-based pricing requires a further adaptation: EVE must be applied at the action level, because credits are consumed action by action, and the value delivered per action varies. This document operationalizes that adaptation. Every phase that follows is an implementation of the principle: the economic value of each credit-consuming action, relative to alternatives, determines its credit weight.
Key Design Decisions for Credit-Based Pricing
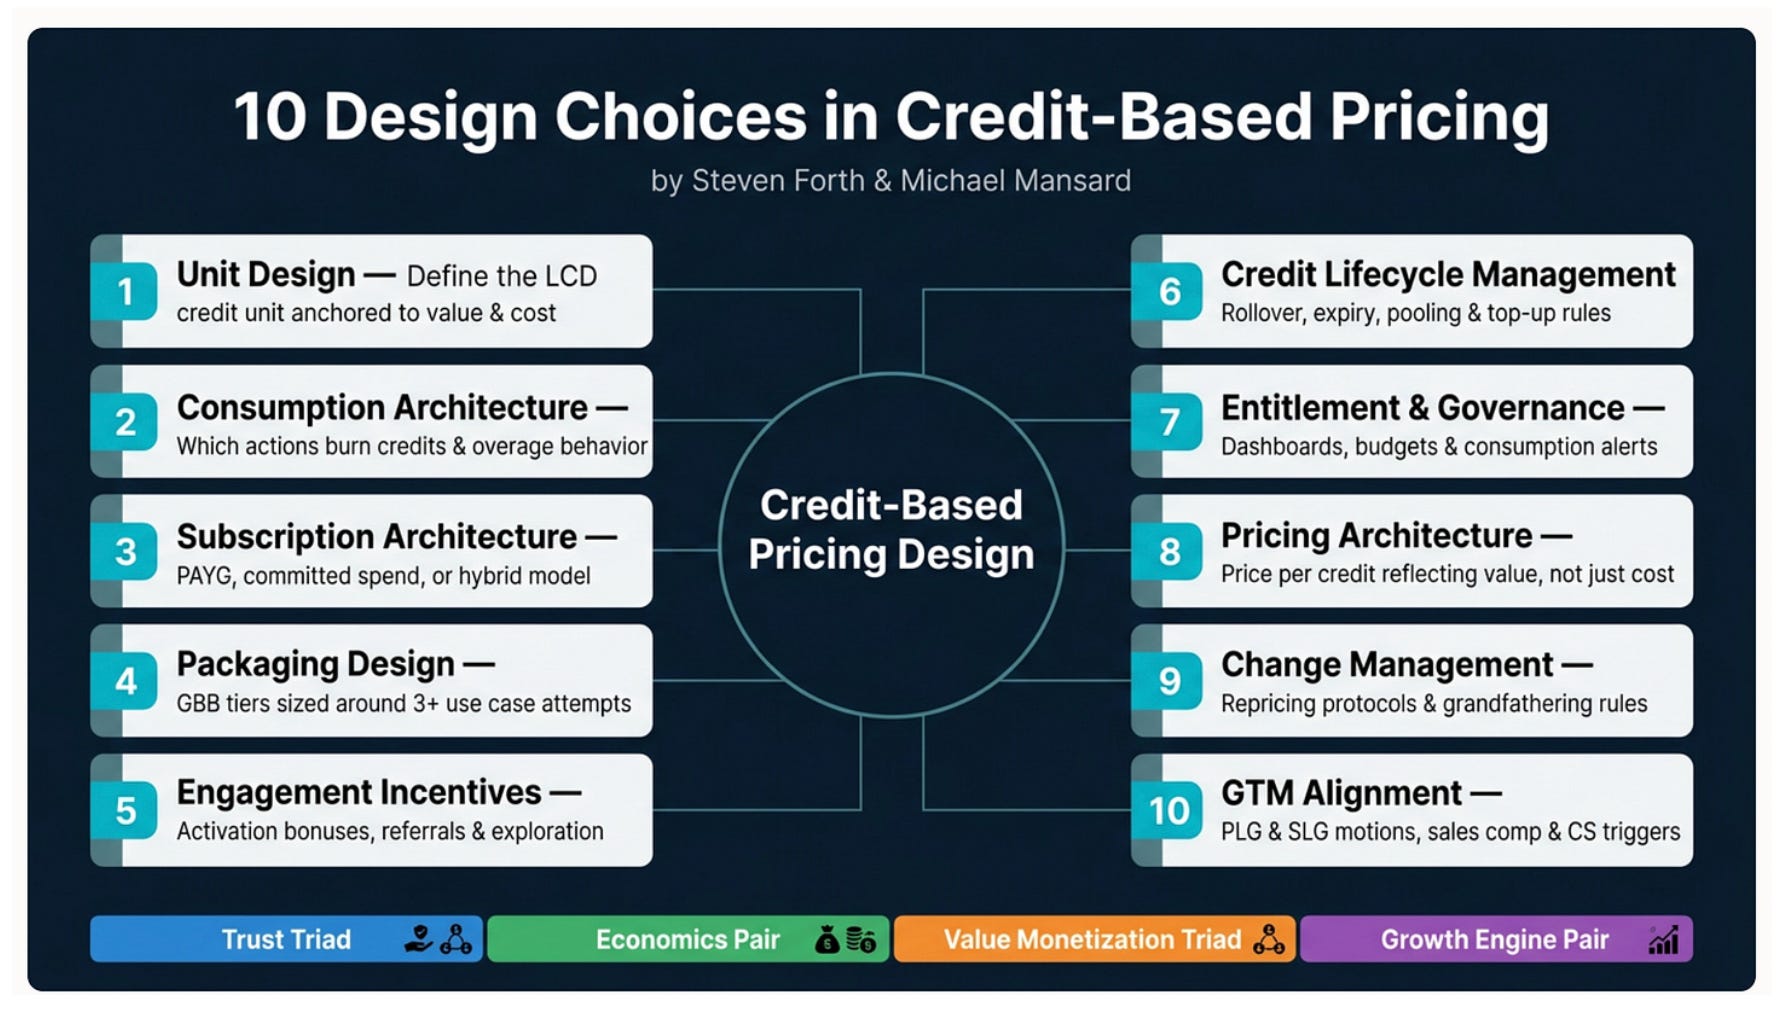
The Trust Triad
These three choices establish the foundation of customer trust in the credit system:
Unit Design — Define the Lowest Common Denominator (LCD) credit unit, anchored to EVE-derived value delivered and cost to serve. The unit must be meaningful to the customer and granular enough to reflect differentiated consumption across use cases.
Consumption Architecture — Determine which actions consume credits, how consumption rates vary by action complexity, and what happens at overages (hard stop, soft cap, or auto top-up).
Entitlement & Governance — Provide customers with dashboards, budget controls, and consumption alerts so they can manage spend with confidence and avoid billing surprises.
The Economics Pair
These choices govern the financial structure of the model:
Subscription Architecture — Choose between pay-as-you-go, committed spend (with a discount), or a hybrid model. Committed spend drives predictable revenue; PAYG lowers friction to entry.
Pricing Architecture — Set the price per credit to reflect EVE-derived value delivered, not infrastructure cost. Credits must encode your margin logic and sustain unit economics as AI compute costs evolve.
The Value Monetization Triad
These choices connect credit design to packaging and customer value realization:
Packaging Design — Structure Good-Better-Best tiers differentiated by segment, not just allowance size. Each tier must be sized around at least 3 meaningful use case completions for its target segment.
Credit Lifecycle Management — Define rollover rules, expiry windows, pooling across seats or teams, and top-up mechanics. Lifecycle rules directly affect perceived fairness and churn risk.
Change Management — Establish repricing protocols, communication cadences, and grandfathering rules for existing customers when credit values or consumption rates change.
The Growth Engine Pair
These choices accelerate adoption and expansion:
Engagement Incentives — Use activation bonuses, referral credits, and exploration grants to drive product-led growth (PLG), reduce time-to-value, and encourage breadth of feature adoption.
GTM Alignment — Align go-to-market motions, sales compensation, and Customer Success intervention triggers to the credit consumption signal. Low burn is an early churn warning; high burn signals upsell opportunity.
The Seven Frameworks
1. COMPASS Framework
(Mansard / Zuora)
What it is: A structured diagnostic for selecting the right pricing metric (inputs → access → activities → outputs → outcomes) before designing the credit model, using a Scope × Attributability matrix and a 14-question Pricing Lever Checklist.
Solves the most fundamental question first — what to charge for — before any credit architecture is designed
Does not prescribe how to design the credit model once the metric is selected; stops at the strategic layer
The Scope × Attributability 2×3 matrix provides a tractable decision tool for cross-functional teams
Requires meaningful telemetry to assess attributability — early-stage products often lack this
Explicitly accounts for adoption dynamics alongside value and cost, preventing metric choices that are theoretically correct but adoption-suppressing
The outcomes tier (highest alignment) is achievable for fewer than 10% of vendors currently
Strong institutional backing (Zuora) makes it credible in board and investor contexts
Best for: Teams at the start of credit model design who have not yet decided whether to charge per seat, per activity, per output, or per outcome.
2. 10-Choice Design System
(Forth / Patternmind / valueIQ)
Design choices in credit based pricing
What it is: The most complete practitioner framework — a 10-choice taxonomy, a 4-goal-cluster prioritization tool, and a 10-step sequential design process anchored in EVE. The only framework that treats all design decisions systematically in one place.
The only framework that treats all design decisions systematically — unit design, lifecycle, packaging, GTM, change management
Can be operationally heavy; executing all 10 choices rigorously requires significant time, data, and cross-functional coordination
The goal clusters prevent premature design decisions by forcing goal prioritization first
EVE methodology requires action-level granularity for both value and cost models — a data prerequisite many companies don’t yet have
The Two Dials insight (price per credit vs. credits per action) reveals pricing flexibility most teams don’t know they have
Leans toward established SaaS companies; less adapted to early-stage ventures making first-pass pricing decisions
Explicitly anchors credit design in EVE-derived value, not cost
Does not deeply address the commercial/sales motion
Lifecycle management rules (ASC 606, expiry, rollover logic) are the most complete treatment in any framework
Best for: Companies doing a rigorous, ground-up design of a credit model with a dedicated pricing team and access to consumption telemetry.
3. Four-Step Credit Calibration
(James Wilton / Monevate)
What it is: A step-by-step credit pricing and calibration process — starting from design principles, through relative value scoring of actions, to triangulating the final credit price against a set of anchors (cost floor, competitive alternatives, WTP research, manual substitutes).
The conceptual reframe — credits are a payment mechanism, not a price metric — resolves a widespread confusion
The relative scoring approach is pragmatic but not full EVE; it can still produce credits anchored to cost if the highest-valued action is itself cost-anchored
The Level 1/2/3 value hierarchy is a useful strategic tool for diagnosing whether a company is using its credit model or just billing with it
The three-level typology is descriptive rather than prescriptive — identifies where companies are, but provides limited guidance on how to move up
The explicit design principles step (Step 0) prevents value/cost drift
Limited guidance on lifecycle management, packaging design, and governance
Triangulated pricing (Step 4) is methodologically sound and accessible to non-specialists
Calibrated for discrete actions; less adapted to multi-agent workflows where value is emergent
Best for: Companies that have already chosen a credit architecture and need a step-by-step process for calibrating prices and credit weights — particularly when full EVE is not feasible and a tractable approximation is needed.
4. Credit-Led Growth (CLG)
(Manny Medina / Paid.ai)
From PLG and SLG to CLG: Monetization Playbook for the AI Era
What it is: A go-to-market and commercial architecture framework that repositions agentic AI as “synthetic labor” competing for operations budgets (not IT budgets), with credits as the billing unit for units of autonomous work performed.
The labor budget framing is strategically powerful — redefines TAM by an order of magnitude and repositions the sales conversation entirely
Highly aspirational; works best for companies with fully agentic, measurable outputs — most products are still hybrid
The “Value-to-Burn” ratio dashboard is a concrete operational KPI that aligns CS, product, and finance teams
CFO-facing forecasts require mature consumption telemetry; most companies are years away from the data quality needed
Addresses the commercial architecture end-to-end: sales motion, CS expansion playbook, CFO framing, pricing narrative
Limited treatment of unit design, lifecycle management, and technical billing infrastructure
The explicit comparison to PLG and SLG helps leadership teams understand why prior GTM motions fail in agentic contexts
The “synthetic labor” narrative can be politically difficult — some enterprise buyers resist framing AI as labor
Best for: AI-native companies with autonomous-enough products to legitimately position credits as units of work delivered — and willing to restructure their commercial organization around it.
5. Bessemer Venture Partners AI Pricing Playbook
The AI pricing and monetization playbook
What it is: An investor-lens business model typology (Copilots / Agents / AI-enabled Services) with associated pricing recommendations, an ROI evaluation 2×2, and a recommended hybrid formula (platform fee + outcome credits).
The Copilot/Agent/Service typology maps cleanly to product maturity and pricing model viability
It is a selection framework, not a design framework; limited guidance on how to build once a model is chosen
The ROI 2×2 (soft vs. hard × revenue vs. cost) is an excellent tool for predicting pricing power and retention risk
The hybrid formula ($2× delivery costs as platform fee + per-outcome credits) is directionally sound but needs local calibration
The 2026 ROI reset warning is timely and actionable — pricing that survived on AI enthusiasm is under renewal pressure
Optimized for venture-backed companies; less relevant for bootstrapped or enterprise-led implementations
Honest about the pricing power differential between copilot and agent models
Does not address the GTM sales motion in depth
Best for: Leadership teams, boards, and investors assessing whether a business model choice is structurally sound before committing to detailed design.
6. Kyle Poyar 2×2 Typology and Dual-Track Model
(Kyle Poyar / Growth Unhinged)
What it is: A market-level classification of four credit archetypes (cost-based vs. value-based × customer-friendly vs. vendor-friendly), plus a dual-track architecture (Platform fees + Token pass-throughs) that separates value billing from cost billing into distinct layers.
The 2×2 is the most useful market positioning tool in the set — it shows where competitors sit and what trade-offs they have made
Classification is descriptive rather than normative; it tells you what quadrant you’re in but not whether that quadrant is right for your context
The dual-track model elegantly solves the cost-pass-through vs. value-alignment tension that plagues most hybrid models
Dual-track requires significant pricing page redesign, CRM restructuring, and sales retraining — high switching cost
The six design rules are a crisp, actionable executive checklist
Less granular than Forth on unit design, lifecycle management, and packaging
The agent-as-buyer frontier (machine-readable pricing, programmable budgets) is the most forward-looking insight in the research
Some insights are observational; lacks the depth of a first-principles methodology
Best for: Companies positioning a credit model in a competitive market and designing their pricing page and commercial narrative — especially useful for product marketing teams.
7. Metronome AI Pricing Index (Field Evidence)
2026 Trends From Cataloging 50+ AI Pricing Models
What it is: An empirical synthesis of 50+ live AI pricing models, identifying observed patterns in how companies are actually designing credit models in production.
Grounded in observed market behavior — valuable as a reality check against prescriptive frameworks
Descriptive by nature; documents what companies are doing, not what they should do
The consumer vs. API split observation and the customer-legibility heuristic are practically actionable
Limited depth per model; observations are patterns, not case studies
Validates the hybrid model trend with empirical evidence (majority of AI models are now hybrid)
No longitudinal view — cannot distinguish transient practices from durable norms
Best for: Benchmarking a credit model design against market practice and identifying whether a proposed architecture is novel, mainstream, or outdated.
The Seven-Phase Design Methodology
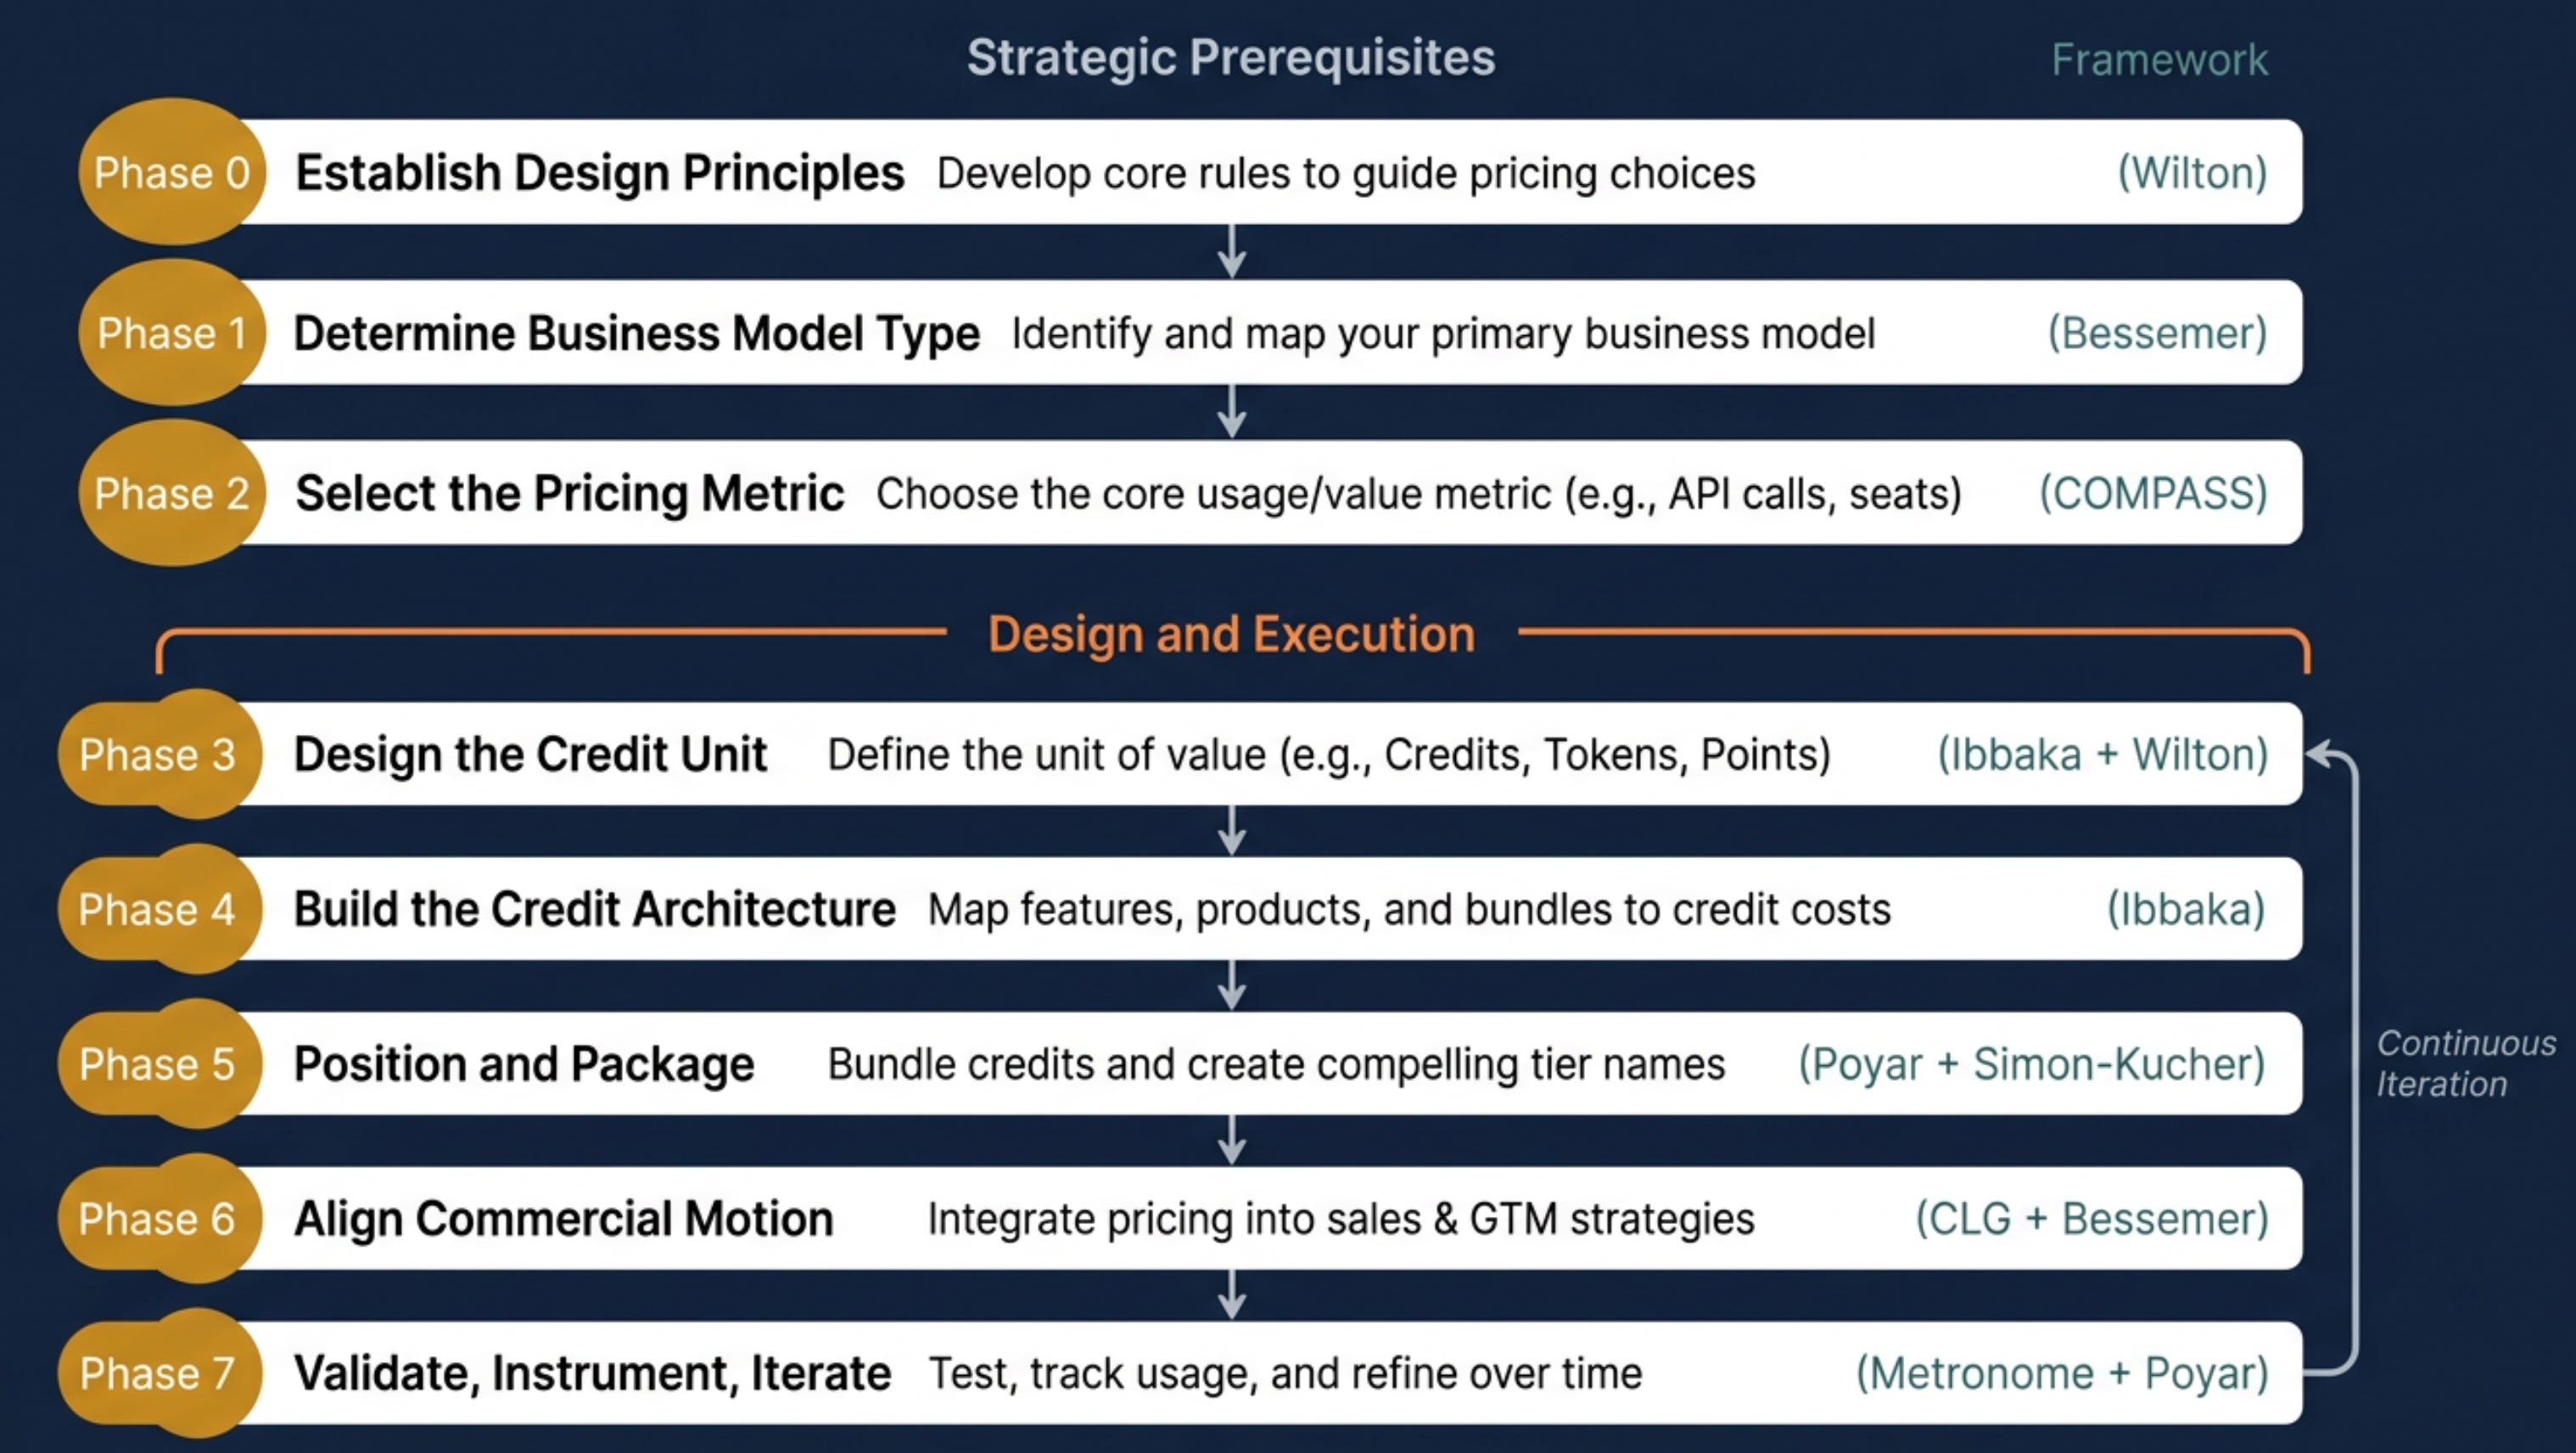
Phase 0: Establish Design Principles
Source: Wilton Four-Step Calibration (Step 0)
Before any analytical work begins, the design team must write down the constraints that any valid credit model must satisfy. These principles serve as a decision-making anchor that prevents value/cost drift during design and change management failures after launch.
How to Do It
Convene the cross-functional pricing design team (Product, Finance, Sales, CS) and produce explicit answers to the following:
What is the minimum value a customer must receive for consuming a single credit? (prevents near-zero-value actions consuming meaningful credits)
What is the margin floor that must hold at all consumption volumes, including the top 10% heaviest users?
What is the maximum cognitive load we will impose on buyers when understanding our credit model? (governs abstraction level and granularity)
What is the advance notice period for any change to credit weights or price-per-credit?
What is our tolerance for pricing complexity at the packaging layer vs. billing layer?
How will we handle credits consumed by automated or agent-to-agent (A2A) transactions as distinct from human-initiated consumption?
Write these down. They are not aspirational statements — they are binding design constraints. Every downstream decision gets tested against them.
What This Phase Produces
A single-page Credit Model Design Principles document, signed off by the Head of Pricing, CFO, and CPO. It serves as the arbiter for design disputes throughout the process and as the reference point for future change management decisions.
Phase 1: Segment Customers
Source: Nagle EVE methodology; Forth SaaS segmentation practice
Why segmentation precedes everything else. Nagle’s core insight is that variation in value-to-customer creates pricing segments, and that segmentation eliminates the false trade-off between price and volume. A credit model without customer segments produces a weighted-average price that systematically underprices high-value customers and overprices low-value ones. In credit-based models, this failure is compounded by the 80/20 consumption pattern: power users extract disproportionate value and will tolerate higher effective prices; light users are price-sensitive and require low entry friction.
The Three Segmentation Dimensions
Define customer segments along three axes:
1. Use Case Intensity — Which workflows does this segment run, how frequently, and at what volume? Segments differentiated by use case intensity will have structurally different credit consumption rates and different value-per-action profiles. A legal team using an AI agent to review 50 contracts per day extracts fundamentally different value than a freelancer reviewing 2.
2. Value Sensitivity — How much economic value does this segment extract per action relative to their next-best alternative? High-value-sensitivity segments (those for whom the alternative is expensive manual labor, costly external vendors, or significant regulatory risk) can bear higher effective credit prices. Low-value-sensitivity segments (those for whom the alternative is nearly free or who use the product for exploration rather than production) require lower effective prices and larger free/seed allowances.
3. Sophistication — Can this segment understand, manage, and predict a credit model? Cognitive load itself suppresses willingness to pay. Developer and technical buyer segments can handle granular credit architectures with action-level pricing; business buyer segments require abstracted, outcome-level credit models where individual credit weights are invisible.
Segment Outputs
For each segment, define:
Primary use cases and expected credit consumption range (min / median / max per month)
Nearest next-best alternative and its fully-loaded cost
Sophistication level (Developer / Business Buyer / Executive Buyer)
Packaging tier most likely to capture this segment
The segment map is a living document. Revisit it at least quarterly as product capabilities expand and new use cases emerge.
Phase 2: Determine Business Model Type
Source: Bessemer AI Pricing Playbook
Not every AI product should use the same credit architecture. The structure of the business model — how value is created, what the vendor controls, and how ROI is attributable — determines which credit architecture is viable.
The Three Business Model Types
Copilot Model: The product assists humans; humans perform the work; AI reduces time or improves quality.
Pricing direction: Per-seat or consumption-based credits; credits meter AI feature usage layered on a user subscription
Credit design constraint: ROI is soft (hard to prove definitively); credits must justify themselves through engagement, not outcome claims
Reference case: Cursor, Figma AI
Agent Model: The product executes entire workflows autonomously; humans review or approve outcomes.
Pricing direction: Output-based or outcome-based credits; credits are consumed upon task completion, not upon inference execution
Credit design constraint: Failed agent runs must not consume credits; output quality is a trust and pricing issue simultaneously
Reference case: Salesforce Agentforce, Intercom Fin
AI-Enabled Service Model: The product blends automation with human expert delivery; the vendor’s labor is the ceiling on unit economics.
Pricing direction: Consumption credits benchmarked against FTE cost of equivalent manual work; TCO narrative is the primary sales tool
Credit design constraint: Credits must be priced against the fully loaded labor cost being replaced, not against inference cost
Reference case: Legal, compliance, and financial data products
The ROI Framing Decision
Within the business model choice, identify whether the primary value narrative is revenue uplift or cost reduction. Cost reduction narratives support more aggressive outcome-based credit pricing because the comparator (FTE cost, outsourcing cost) is known. Revenue uplift narratives require more conservative credit architectures and stronger engagement guarantees.
Bessemer’s 2026 warning deserves emphasis: “Soft ROI worked in 2025’s AI adoption environment. As pilots hit renewal, pricing must reflect actual value delivered, not promise.” Design for renewal-proof value clarity from day one.
Phase 3: Select the Pricing Metric
Source: COMPASS Framework (Mansard/Zuora)
The pricing metric is the dimension along which customer value scales most reliably, and it is the object that credits will measure. Metric selection precedes all credit architecture decisions. A credit model built on the wrong metric cannot be fixed by downstream design choices.
The COMPASS Metric Spectrum
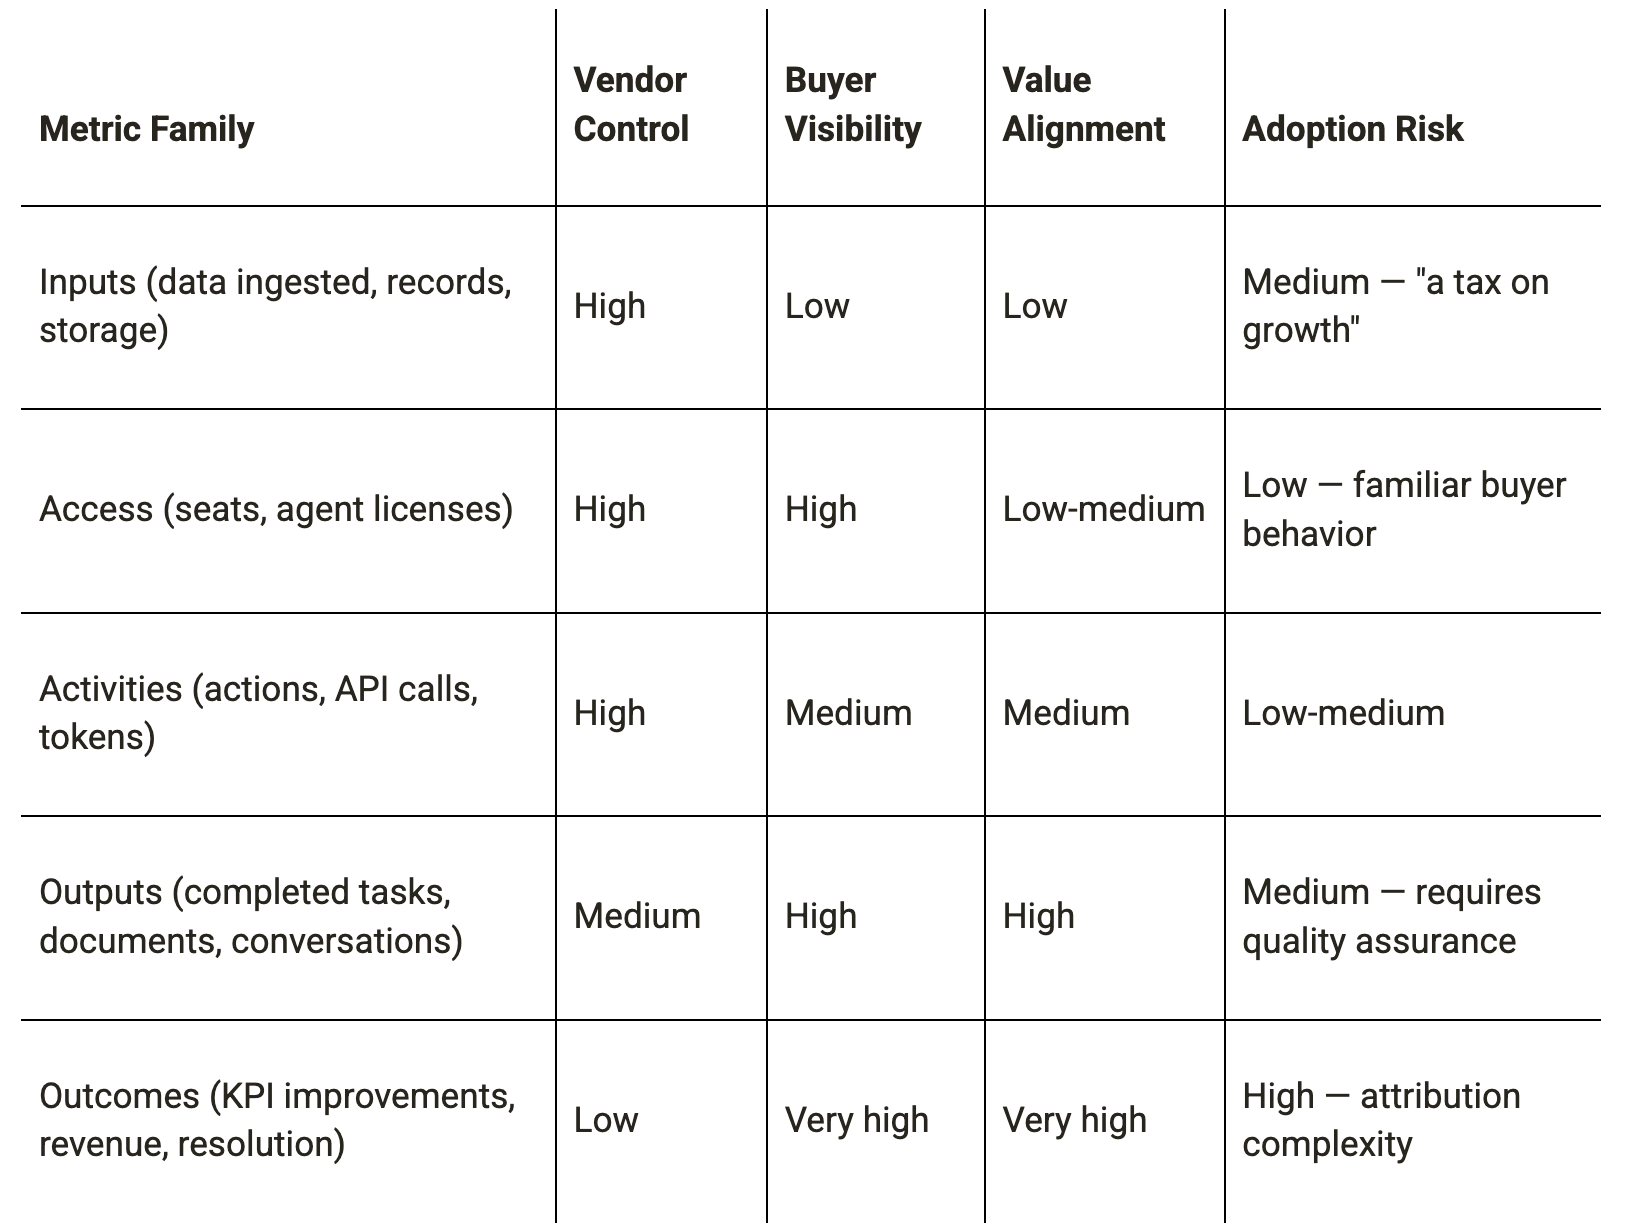
Credits can express any metric family. The choice of metric determines what “one credit” means to the buyer — and this meaning must hold for every customer segment identified in Phase 1.
The COMPASS Evaluation Matrix
Apply a 2×2 evaluation using Scope of Work (what the agent autonomously completes) against Attributability (how clearly that value can be claimed):
High scope + High attributability: Output or outcome metrics are viable. Invest in measurement infrastructure to claim premium WTP.
High scope + Low attributability: Output metrics with quality guarantees. Add SLA terms to the credit design.
Low scope + High attributability: Activity metrics are appropriate. Credits per verified action step.
Low scope + Low attributability: Access or activity metrics. Avoid outcome pricing — the measurement infrastructure does not support it.
The 14-Question Pricing Lever Checklist
Before finalizing the metric, run through three constraint families:
Adoption constraints (will this metric suppress trial and expansion?):
Can buyers estimate their credit consumption before committing?
Does the metric create “usage anxiety” (reluctance to run queries for fear of burning credits)?
Is the first meaningful experience achievable within a standard free/seed credit allowance?
Does the metric work for every customer segment, or does it penalize low-sophistication segments?
Monetization constraints (does this metric capture differential value across customers?):
Do high-value customers consume more of this metric than low-value customers?
Can the metric be measured and billed accurately in real-time?
Is the metric visible enough to support expansion conversations?
Operational constraints (can the billing infrastructure support this metric?):
Is event-level metering technically feasible for this metric?
Can failed or partial executions be distinguished from successful ones?
Does the metric create revenue recognition complications under ASC 606?
The Metric Selection Output
Produce a single validated pricing metric — one sentence: “One credit represents [one completed X / one verified Y / N units of Z].”
If the team cannot produce a clear, single sentence, the metric selection is not complete. Ambiguity at this stage propagates into every downstream design choice.
Note: A hybrid metric may be warranted — for example, a base metric (per seat or per workflow) with an overlay credit metric (for AI feature consumption). The COMPASS framework explicitly permits hybrid architectures but requires that each metric layer be validated independently.
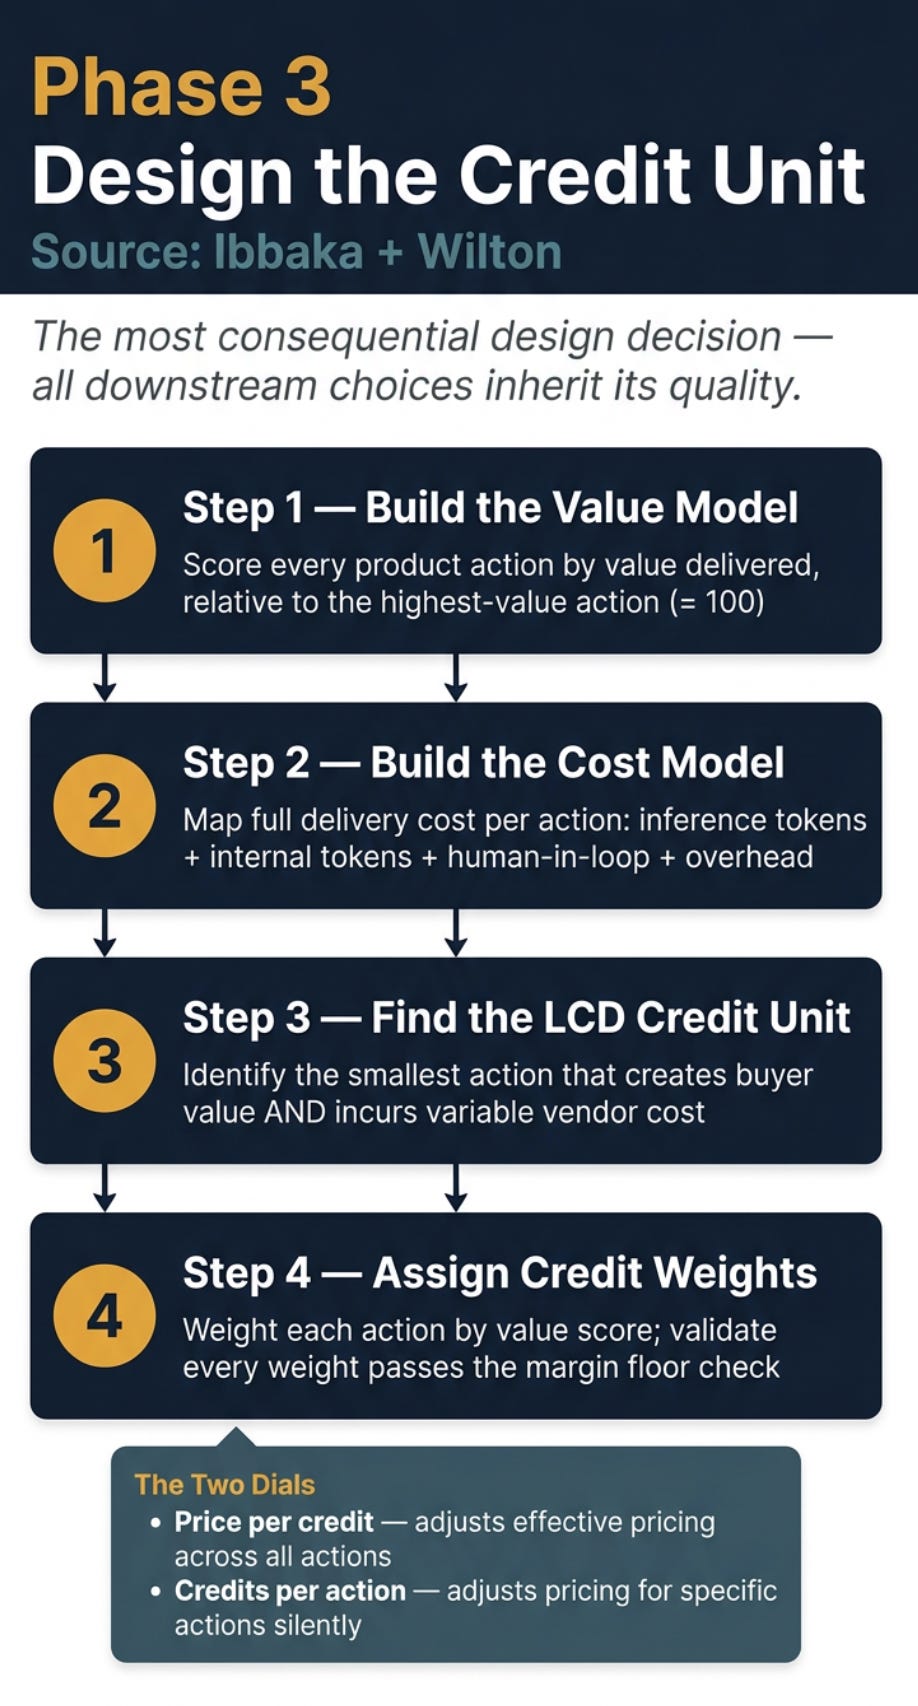
Phase 4: Design the Credit Unit
Source: Forth 10-Choice System (Unit Design), Wilton Four-Step Calibration, Nagle EVE
Credit unit design is the single most consequential and most commonly mishandled phase. The unit is the foundation; everything downstream — packaging, lifecycle, pricing — inherits its quality or its flaws.
The Three Questions of Unit Design
What does one credit let the buyer do? (Value definition)
How much economic value does consuming one credit deliver, relative to the buyer’s next-best alternative? (EVE)
How much does it cost to execute that action? (Cost model)
All three must be answered with action-level granularity before the credit unit can be defined.
Step 1: Build the Value Model Using EVE (Nagle / Forth)
The correct methodology for value-based credit weight design is Nagle’s Economic Value Estimation (EVE), adapted to the action level.
For every action the product can perform, calculate:
EVE = Reference Value + Positive Differentiation Value − Negative Differentiation Value
Reference Value: The fully-loaded cost of performing this action using the buyer’s next-best alternative. This is the price ceiling — the buyer will not pay more than the value of the alternative. Next-best alternatives include:
Manual execution (time × fully-loaded labor rate for the relevant role)
External vendor or contractor cost
Competing software (effective per-action cost based on their pricing)
Positive Differentiation Value: The measurable advantages of performing this action with your product vs. the next-best alternative:
Speed advantage (time saved × labor rate)
Accuracy improvement (error rate reduction × cost of errors)
Scale advantage (volume increase achievable without proportional cost increase)
Compliance or risk reduction (expected value of avoided penalties, errors, or rework)
Revenue uplift (where directly attributable)
Negative Differentiation Value: The disadvantages or costs that reduce the buyer’s net value:
Switching and integration cost (amortized over expected contract life)
Reliability uncertainty (expected value of failed runs, rework, or quality review)
Adoption and change management cost
Lock-in risk (option value of alternatives foregone)
Important: Negative differentiation values are frequently underestimated. AI products with reliability below buyer expectations carry substantial negative differentiation value that erodes the price ceiling significantly.
The EVE calculation produces an Economic Value per Action for each action in the product’s capability set. This is the theoretically correct upper bound for credit weight assignment, expressed in monetary terms.
When to use Wilton’s Relative Scoring as an Approximation
Full EVE requires action-level granularity for both reference values and differentiation values — a data prerequisite that some early-stage companies cannot meet. In these cases, Wilton’s relative scoring provides a tractable approximation: assign the most valuable action a score of 100 and score all other actions relative to it. This produces a Value Weight Table.
Critical caveat: If the highest-valued action is itself cost-anchored (i.e., its “value” was estimated by looking at delivery cost rather than economic value to the buyer), the entire relative scoring exercise inherits a cost-plus error. Before using Wilton’s scoring, independently validate the EVE of the top-scoring action against at least three reference value comparators.
Do not skip value modeling and substitute cost-based scoring. The most prevalent design failure in current market implementations is pricing credits as “fancy cost-plus” — mapping credits directly to token costs — which systematically underprices and erodes WTP.
Step 2: Build the Cost Model (Forth)
For each action, model the full delivery cost stack:
Direct inference cost: Prompt tokens + completion tokens for all model calls in the action
Internal token cost: Intermediate reasoning steps, tool calls, agent orchestration — typically 50–90% of total token consumption and frequently omitted from cost models
Human-in-the-loop cost: Any human review, QA, or exception handling per action
Infrastructure and overhead allocation: Storage, latency optimization, compliance logging
The cost model must be tested for scale: does the cost-per-action change materially as consumption grows? If the top 20% of users can consume credits at near-zero marginal cost (e.g., through context reuse), the cost model breaks at scale.
Step 3: Find the Lowest Common Denominator (LCD) Credit Unit
The LCD is the smallest action that simultaneously:
Creates measurable value for the buyer
Incurs a variable delivery cost for the vendor
Decision rule: if the unit of value is larger than the unit of cost (the common case), use the smallest unit of value. Avoid fractional credits — they confuse buyers and suppress engagement.
Test the proposed LCD against the Value Weight Table: Can all actions in the table be expressed as a whole-number multiple of the LCD without requiring more than 3 significant figures? If not, the LCD is too small. If the largest action requires thousands of credits, the LCD is too small and the pricing page will become incomprehensible.
Step 4: Assign Credit Weights to All Actions
With the LCD defined, assign credit weights using the EVE-derived Value Weight Table — not the Cost Weight Table. Anchor to economic value, then validate that each weight preserves an acceptable margin:

Where the margin floor is the design principle from Phase 0.
If a value-based weight fails the margin check, the action is unmonetizable at the proposed price-per-credit. Either the price-per-credit must increase, or the action must be excluded from credit billing (absorbed into the platform fee).
Document the full Credit Weight Register — action name, EVE-derived economic value, value weight, cost per execution, effective margin at current price-per-credit, and the last date each weight was reviewed. This register is a living document, not a launch artifact.
The Two Dials
Following Forth’s operational insight, internalize that two levers are always available without structural model change:
Price per credit: Adjusting this changes effective pricing for all actions simultaneously
Credits per action (weight): Adjusting this changes effective pricing for specific actions without a price announcement
This asymmetry is strategically significant: increasing weights on specific high-value actions is a value-extraction move that can be implemented without triggering broad buyer awareness of a “price increase.” It is also the primary tool for competitive response (see Phase 7).
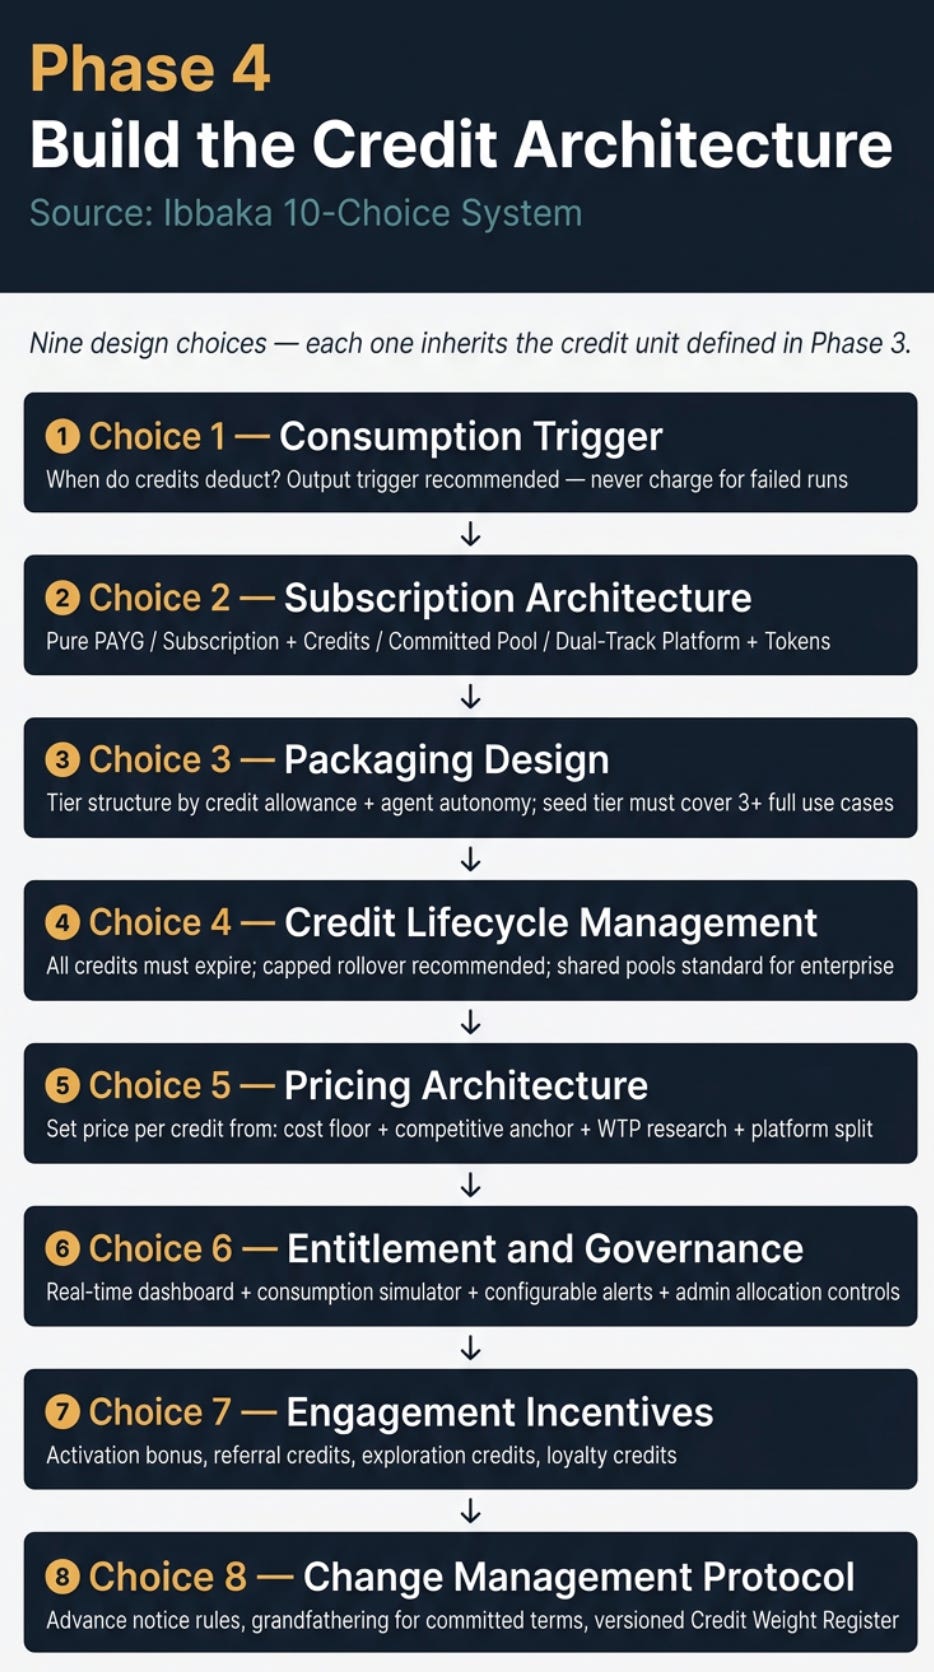
Phase 5: Build the Credit Architecture
Source: Forth 10-Choice System (Choices 2–10)
With the credit unit defined, the remaining nine design choices can be made. They are presented in their logical dependency order.
Choice 1: Consumption Architecture
Define the trigger for credit consumption:
Event trigger: Credits consumed when an agent run is initiated — the worst option for trust, as failed runs consume credits
Output trigger: Credits consumed when the agent successfully delivers an output — the current best practice for agentic AI
Outcome trigger: Credits consumed when a defined business outcome is verified — highest value alignment; requires measurement infrastructure
Key rule: The output trigger is current best practice. Failed runs must not consume credits — this is the leading cause of trust failure in current implementations. If failed-run cost absorption is economically untenable, implement a partial-credit policy (e.g., 10% of credits consumed on failure, 100% on success) rather than a full-consumption policy.
Define handling for:
Partial completions (agent completes 3 of 5 steps before timeout)
Retries (same task re-executed after failure)
User-initiated cancellations
Agent-to-agent (A2A) calls (see Phase 7)
Choice 2: Subscription Architecture
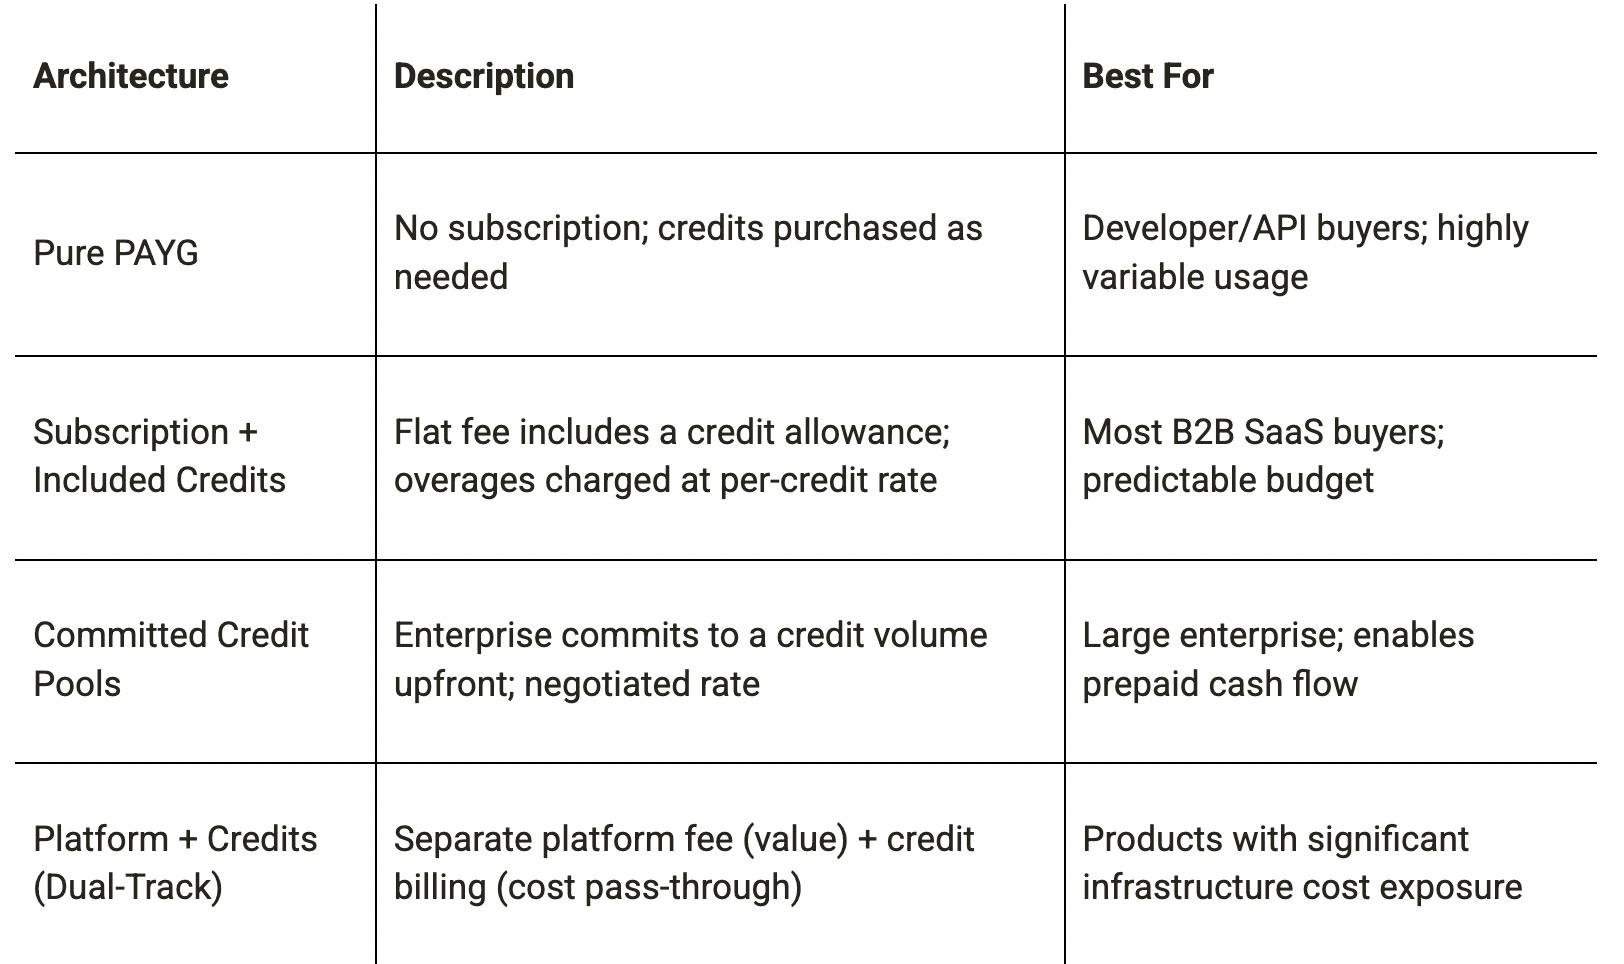
The dual-track model (Poyar) is the most structurally sound for companies whose AI model costs are volatile. It separates the value discussion from the cost discussion, allows transparent cost pass-through as LLM prices decline, and preserves platform margin even when token costs fall.
Choice 3: Packaging Design
Packaging organizes credit access into buyer-facing tiers anchored to the customer segments defined in Phase 1. Key decisions:
Tier structure: Good-Better-Best tiers differentiated by monthly credit allowance, agent capability, and governance features — designed around segments, not around arbitrary seat counts
Seed tier design: Free or trial tiers must include enough credits to complete at least three full end-to-end use case runs. Undersized seed tiers produce activation failure, not upgrade pressure.
Feature gating vs. credit gating: Features that define tier differentiation (higher autonomy, advanced models, priority processing) should be tier-gated, not credit-gated. Credit gating should govern consumption volume, not capability access.
Add-on packs: Top-up credit packs should be priced at the same per-credit rate as the purchased tier, not at a premium overage rate, to avoid churn-inducing “bill shock.”
Segment-differentiated tiers: If Phase 1 identified two or more structurally distinct customer segments with different value sensitivities, consider separate packaging tracks rather than forcing all segments through the same GBB tier structure.
Choice 4: Credit Lifecycle Management
Expiration (non-negotiable): All credits must expire. Non-expiring credits create an unbounded deferred revenue liability under ASC 606 and cannot be recognized as revenue. The standard architecture: credits expire at the end of the commitment period.
Rollover (design decision):
No rollover: Maximum revenue recognition speed; poorest buyer experience
Capped rollover: Unused credits roll into the next period up to a defined cap (e.g., 2× monthly allowance) — the recommended default
Uncapped rollover: Full balance carries forward; buyer-friendly but creates liability management complexity and suppresses upgrade pressure
Rolled-over credits do not compound — they may roll over exactly once.
Pooling: Shared credit pools across users within an account are becoming the standard enterprise architecture. The 80/20 pattern makes shared pools economically efficient for buyers and reduces per-seat friction in procurement. Design pooling as an account-level feature available from Pro tier upward.
Credit gifting: User-to-user transfer within an account is an emerging viral growth mechanism. Include it in the architecture even if not launched at v1.
Choice 5: Pricing Architecture
Set the price per credit. The pricing inputs are:
Economic floor: Minimum price-per-credit at which the margin floor from Phase 0 holds at median consumption — derived from the cost model in Phase 4
Competitive anchor: Effective per-credit rate of the nearest alternative (next-best alternative, including manual substitutes) — derived from the EVE reference values in Phase 4
WTP research: Direct elicitation at action-level granularity using action-level conjoint, or at pack-level using van Westendorp (see WTP Methodology box below)
Platform + Token split: If using dual-track architecture, determine what portion of value pricing sits in the platform fee vs. the credit rate
WTP Methodology
The document recommends two instruments calibrated to different use cases:
Action-level conjoint analysis: Frame conjoint tasks around bundles of actions (e.g., “a workflow that includes document extraction, entity resolution, and report generation”) rather than individual features. Measure WTP for the workflow bundle, then decompose to constituent actions using part-worth utilities. This provides the most rigorous WTP estimate for individual credit weight calibration. Use when you have 150+ survey-eligible buyers in the target segment and can run a 15–25 minute conjoint survey.
Pack-level van Westendorp: Apply the Price Sensitivity Meter at the credit pack level — asking buyers at what pack price the product feels “too cheap to be trustworthy,” “a bargain,” “beginning to be expensive,” and “too expensive.” This defines the acceptable price range for seed, mid-tier, and enterprise packs. More tractable than action-level conjoint and appropriate for early-stage companies without a large existing customer base.
Apply the design principles from Phase 0. If the triangulated zone between economic floor and WTP ceiling is narrow, it indicates either that margins are structurally thin (review the business model) or that value capture at the action level is insufficient (return to unit design).
Volume discount caution: Resist the pull toward volume discounts on a per-credit basis. AI delivery costs are real and largely variable. Deep per-credit discounts at scale erode margins at precisely the highest-volume customers — the opposite of healthy SaaS economics.
Choice 6: Entitlement and Governance
Governance tooling is a first-class design requirement, not a post-launch addition:
Real-time credit dashboard: Account-level balance, consumption by user, consumption by action type, period-to-date velocity, estimated time to depletion at current run rate
Consumption simulator: Pre-execution estimate of credit cost for a proposed task, visible before the user commits to running it — the single most effective tool for eliminating “usage anxiety”
Configurable alerts: Threshold-based notifications at 50%, 75%, 90% of period allowance, sent to both end user and account admin
Admin allocation controls: Ability for account administrators to allocate sub-pools to teams or users, preventing concentration risk
A2A budget controls: Controls for automated agent-initiated credit consumption, including per-agent credit caps and real-time kill switches for runaway agent loops (see Phase 7)
Choice 7: Engagement Incentives
Design activation and expansion behaviors into the credit model from the start:
Activation bonus: A one-time credit grant for completing onboarding steps — connects first credit consumption to a guided first-value moment
Referral credits: Credits granted to both referrer and new account on successful signup — the primary viral growth mechanism in credit models
Exploration credits: Small credit grants when new feature capabilities are made available — drives adoption without requiring tier upgrade
Loyalty credits: Incremental credit bonuses at account anniversary — reinforces renewal and counters competitive solicitation
Choice 8: Change Management Protocol
Design the repricing and credit weight change protocol before launch:
Minimum advance notice: 30 days for weight changes on core actions; 60 days for price-per-credit changes; 90 days for architectural changes (expiry policy, rollover policy)
Grandfathering rules: Customers on annual commitments maintain current weights for the duration of their committed term
Version control: Maintain a dated Credit Weight Register — every weight change is logged with the effective date, old weight, new weight, and rationale
Communication protocol: Weight changes communicated through in-product notifications, email, and account manager briefing for enterprise accounts
Phase 6: Position and Package
Source: Poyar 2×2 Typology
Locate the Credit Archetype (Poyar 2×2)
Identify which of the four credit archetypes the designed model most closely resembles:
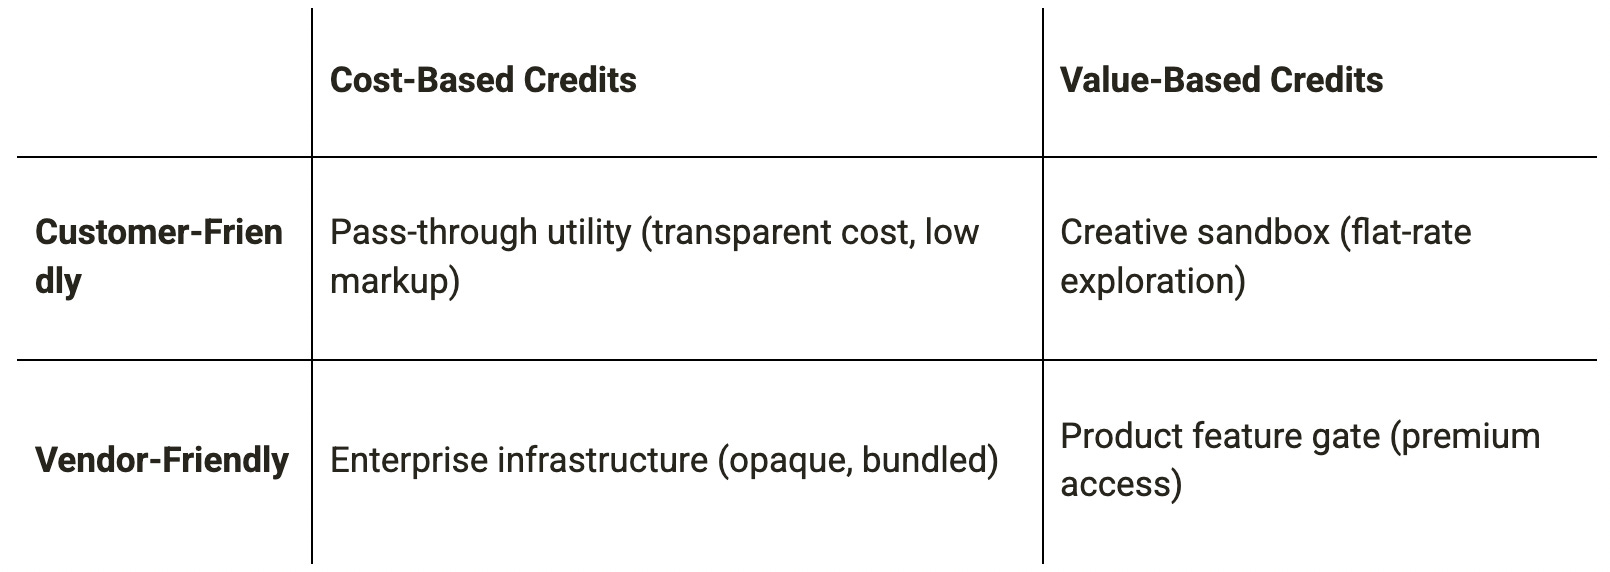
Knowing which quadrant the model occupies clarifies the positioning narrative:
Pass-through utility: Lead with cost transparency; compete on price predictability
Creative sandbox: Lead with creative freedom; compete on experience and limit removal
Enterprise infrastructure: Lead with reliability, compliance, and governance; compete on trust
Product feature gate: Lead with capability and outcomes; compete on ROI
If the model falls in the vendor-friendly quadrants, audit whether buyers have enough pricing sophistication to accept this — enterprise procurement teams increasingly pressure-test credit architectures and will surface opacity at renewal.
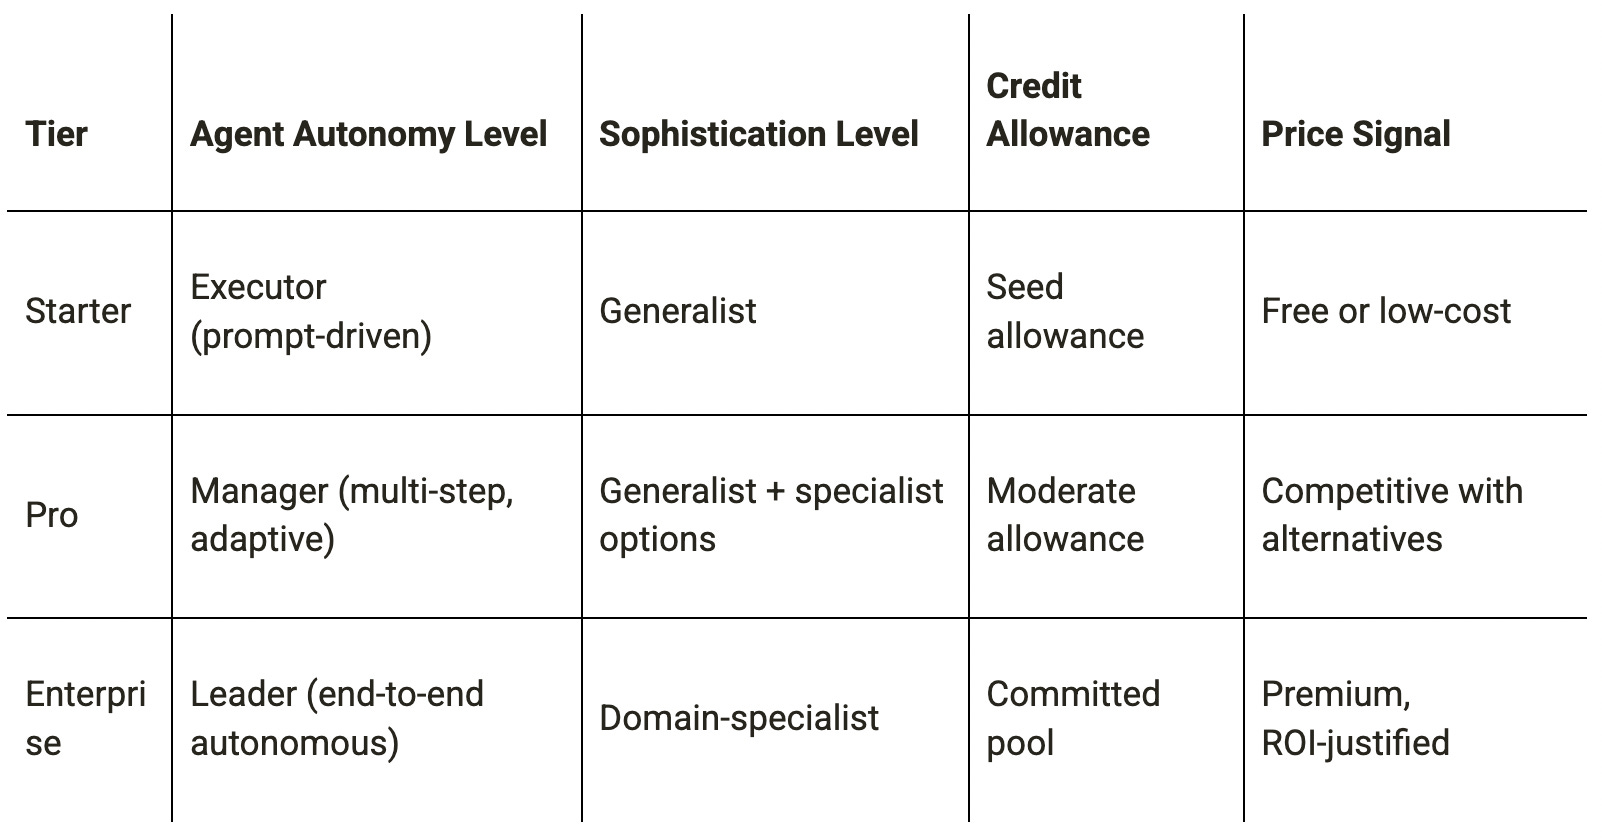
Packaging Against Agent Autonomy Tiers
The Dual-Track Pricing Page
For products using the dual-track architecture (Platform + Tokens):
Present the platform fee as the primary pricing commitment — associated with the value the product delivers
Present token/credit consumption as a secondary, transparent cost layer — described in cost terms, not value terms
Provide a consumption estimator on the pricing page anchored to reference workflows for each segment
Packaging-Metric Alignment (Nepveux / Simon-Kucher)
Packaging must support the pricing metric, not fight it. Misalignment between tier design and pricing metric is a leading cause of upgrade friction. Test every tier boundary against the question: Does moving from this tier to the next tier correspond to a meaningful increase in value delivered to this customer segment? If the answer is “no,” the tier boundary is in the wrong place.
Phase 7: Competitive Pricing Dynamics and A2A Frontier
Source: Nagle competitive pricing framework; Poyar agent-as-buyer concept; Forth 2026 A2A predictions
This phase addresses two forward-looking design requirements that are absent from most current credit pricing frameworks but are essential for 2026 and beyond.
Part A: Competitive Pricing Dynamics
Nagle identifies competitive price setting as one of the five core elements of pricing strategy. A credit model that does not include a competitive response protocol is incomplete.
Competitive credit architecture decoding: Reverse-engineer competitors’ effective per-action pricing from their published credit tables using the Metronome methodology:
Identify their reference workflows (publicly described use cases)
Estimate credit consumption per workflow from published documentation and customer community posts
Compute effective per-action price = (pack price ÷ pack credits) × (credits per action for the reference workflow)
Map against your EVE Reference Values to identify where competitors are above or below economic value
Asymmetric response options using the Two Dials:
Defensive: When a competitor lowers prices, adjusting weights on competitive overlap actions is a more targeted response than a broad price reduction. A 15% weight reduction on the three most-contested actions can match a competitor’s effective price cut without broadcasting a general price decrease.
Offensive: When entering a market where an incumbent has entrenched credit pricing, launching with transparent, value-anchored weights signals value orientation and attracts the incumbent’s overpriced customers.
Repositioning: If a competitor occupies the cost-based/vendor-friendly quadrant (Poyar 2×2), the strategic response is to move to the value-based/customer-friendly quadrant — competing on transparency and fairness rather than on rate.
Pricing for switching: Credit model lock-in is real — credit wallets, committed pools, weight familiarity, and consumption pattern expectations all create switching friction. To accelerate competitive switching:
Offer a credit migration guarantee: new accounts coming from a named competitor receive a credit allowance calibrated to their prior consumption level for the first 90 days
Publish a credit comparison calculator on the pricing page that converts a competitor’s credit consumption to your equivalent cost
Price the first committed pool at a discount that neutralizes the switching cost (estimated from negative differentiation value in Phase 4)
Part B: Agent-to-Agent (A2A) Pricing Frontier
As agentic AI matures, a significant and structurally new challenge emerges: AI agents from different vendors, or from the same vendor, will call each other’s services as part of automated workflows. This is the A2A economy, and it requires a pricing architecture that no current framework fully addresses.
Machine-readable pricing specifications: Credits consumed by automated API calls from other agents should be priced on the same value logic as human-initiated consumption, but expressed in a machine-parseable format. An orchestrating agent must be able to evaluate the cost of a subagent’s service call before committing a budget. This requires:
A pricing API endpoint that returns current credit rates for each action type in a structured format
A cost-estimation API that accepts a task description and returns a credit cost estimate before execution
Version-stamped pricing specifications so orchestrating agents can detect price changes between calls
Programmable credit budgets: Enterprise buyers in agentic environments will delegate credit allocation to orchestrating agents with budget caps. The governance architecture (Phase 5, Choice 6) must account for agent-initiated consumption as a first-class consumption type:
Per-agent credit caps: maximum credits an automated agent can consume per session or per period
Real-time kill switches: ability to halt an agent’s credit consumption immediately if anomalous patterns are detected (runaway loops, unexpected tool calls, cost overruns)
Audit trails: full logging of agent-initiated consumption events with task descriptions, model calls, and credit amounts — essential for enterprise procurement review
Revenue sharing in multi-agent pipelines: When value is produced by a chain of agents from different vendors — an orchestrator calling a document extractor, an entity resolver, and a report generator — the credit pricing design must address attribution. This is the Shapley value problem applied to commercial pricing:
The Shapley value framework from cooperative game theory assigns credit (revenue) to each agent in a coalition proportional to its marginal contribution to the coalition’s output value. For practical implementation:
Define the value of each subagent’s output independently (what would the buyer pay for this output alone?)
Define the value of the full pipeline output (the coalition value)
Each subagent’s fair credit price = its Shapley value (its average marginal contribution across all possible orderings of the pipeline)
Full Shapley calculation is computationally demanding. For practical implementation, a two-step approximation is sufficient: (a) measure the pipeline’s full output value using EVE; (b) allocate credit revenue to each component service proportional to its contribution to the pipeline’s positive differentiation value over the next-best-alternative pipeline.
The A2A pricing frontier is early-stage in 2026. Companies that design their credit architectures with machine-readable specifications and programmable budgets now will have a structural advantage as the agentic ecosystem matures.
Phase 8: Rebuild the Commercial Motion
Source: CLG Framework (Medina / Paid.ai); Forth 10-Choice System (GTM Alignment)
The Labor Budget Reframe
For companies with Agent Model business types (Phase 2), the CLG framework’s reframe is strategically essential: position credits not as a software billing mechanism but as units of autonomous work performed. This repositions the sales conversation from IT procurement to operations budget — a buyer with fundamentally different WTP and a budget that scales with the work performed.
The labor budget reframe requires:
Quoting in FTE-equivalent terms: “This credit pool is equivalent to 2.3 FTEs of [role] work per month, at a fully-loaded cost 67% below market”
The Value-to-Burn ratio dashboard: credits consumed ÷ documented business value produced, tracked weekly by Customer Success
CFO-facing forecasts expressed in labor cost avoidance terms, not in credit consumption terms
Sales Compensation Restructuring
Sales teams on seat-based quota will optimize for seat count and undervalue credit pool size. Restructure compensation:
Primary quota metric: committed credit pool ARR (annual value of contracted credit pools)
Secondary metric: credit utilization rate at 90 days (a proxy for time-to-value and renewal health)
Commission acceleration: higher rates for multi-year committed pools, which provide superior revenue predictability
Customer Success Intervention Triggers
The credit consumption signal is the highest-fidelity leading indicator of customer health in credit models:
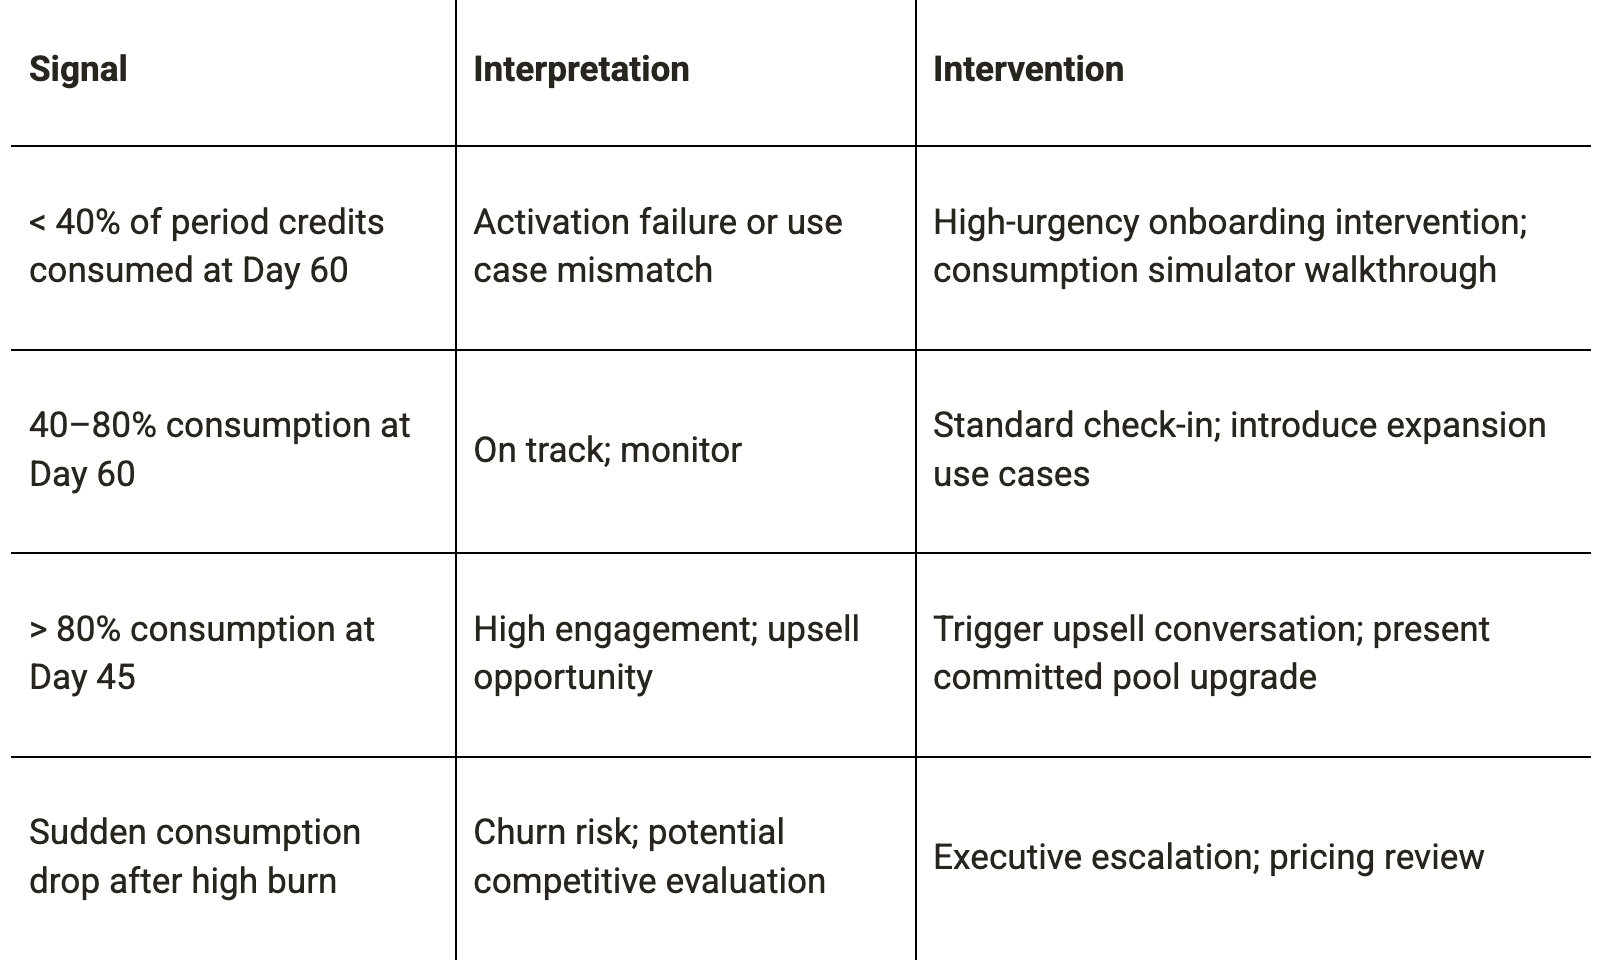
Synthesis: The Non-Negotiable Rules
These rules represent the points of consensus across all seven frameworks. Violating any of them produces a flawed credit model:
Value > Price > Cost — always. At every consumption volume, for every customer segment. There are no exceptions to the hierarchy.
Segment before you design. A credit model without customer segmentation produces a weighted-average price that serves no segment well.
Select the metric before designing the unit. A credit model built on the wrong metric cannot be fixed downstream.
Use EVE for credit weight assignment, not cost-plus indexing. Reference Value + Positive Differentiation Value − Negative Differentiation Value is the correct formula. Relative scoring is an approximation, not a substitute.
Failed agent runs must not consume credits. This is the leading cause of trust failure. Non-negotiable from launch.
All credits must expire. Non-expiring credits are poison and make revenue recognition impossible.